

The gold-silver ratio is expanding again. This could signal that silver is setting up to resume its bull run. However, plenty of headwinds continue to buffet the market.
What Is the Gold-Silver Ratio?
The gold-silver ratio shows how many ounces of silver it takes to buy one ounce of gold at their current spot prices.
In other words, it tells you the price of gold in silver ounces.
Historically, the ratio has averaged between 40-1 and 60-1 in the modern era. When the ratio expands far beyond that average, it tends to eventually snap back to that mean, often very quickly.
For instance, in 2020, the gold-silver ratio set a record of 123-1 as COVID hysteria gripped the world. The ratio then plunged to around 60-1 as central banks cranked up the money creation machine to cope with governments shutting down economies. At the same time, silver gained approximately 157 percent between March and August 2020, climbing from $11.64 to $29.86 per ounce.
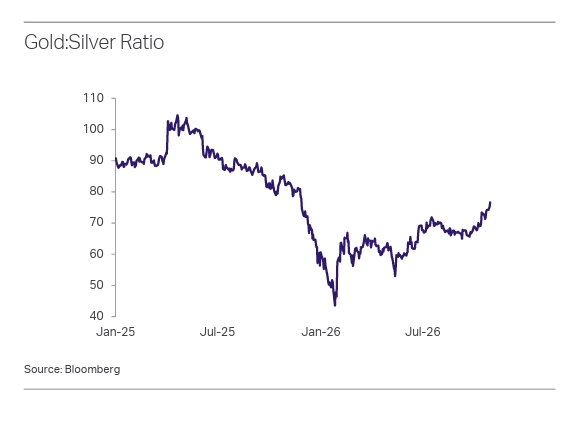
More recently, the gold-silver ratio fell from around 82-1 in October 2025 to about 46-1 around silver’s $122 January peak. In April 2025, the ratio peaked around 105-1 as the market set up for the bull run later that year.
What Is the Gold-Silver Ratio Today?
Since then, the gold-silver ratio has been generally range-bound between 60 and 70-1 since June. That’s just above the high end of the modern average. However, the ratio has started widening again. As I write this, it stands at about 77-1.
This raises a question: what’s causing silver to underperform compared to gold in the current environment?
Both metals face significant headwinds from rising yields and expectations of additional Federal Reserve rate hikes. Because precious metals are non-yielding assets, gold and silver tend to struggle in higher-yield environments.
However, despite the headwinds, the gold market continues to get support from central bank gold buying and Asian investors, particularly the Chinese.
As Metals Focus analysts noted, “Silver, by contrast, is viewed more as an industrial commodity and does not enjoy the same quasi-monetary attributes as gold.”
The physical tightness in the silver market that drove prices higher during two distinct squeezes in October 2025 and January 2026 has also eased.
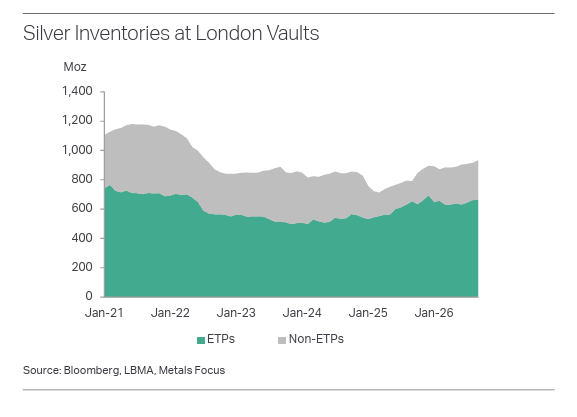
After falling to record lows late last year, silver inventories in London vaults were at a 4-year high of 932 million ounces at the end of September, according to Metals Focus.
“Excluding metal tied up in physically backed ETPs, free-float London inventories stood at around 267Moz, nearly double the lows recorded in October 2025 and almost back to levels seen before the Trump tariff-related disruptions.”
Metals Focus analysts said inventories at key commodity exchanges in the U.S., China, and India also grew modestly in recent months. Rapid cooling of investor interest after the January peak was the “key contributor” to this improving liquidity.
“In 2025, substantial inflows into silver ETPs quickly absorbed liquidity in London. This year, however, silver ETP holdings have fallen by roughly 60Moz year-to-date, releasing metal that was previously tied up. Initially, this year’s outflows reflected profit-taking as prices reached a series of record highs. While these net liquidations quickly subsided, a lack of conviction in the near-term price outlook has also restrained fresh investment in silver.”
Analyst Jesse Colombo said a lot of the bearishness in the silver market comes from investors who got in late and jumped out early.
“They piled in near the very top, just weeks or even days before silver peaked at $121, only to lose interest when it corrected, as all overheated assets eventually do. Then they simply moved on to what they believe is the latest and greatest hot asset, whether it’s an overvalued and overhyped AI stock, a new cryptocurrency, or whatever else the lemmings are currently piling into.”
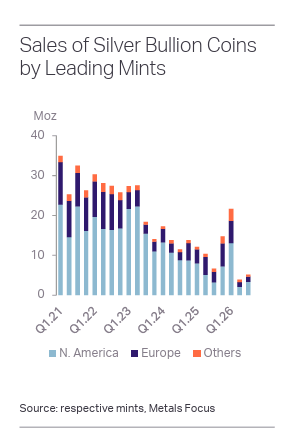
Since then, Western investors have shown little interest in silver, evidenced by coin sales. According to Metals Focus, “Following a surge in Q1.26, sales of primary silver bullion coins by leading mints plunged by over 80 percent q/q in Q2, reaching their lowest quarterly level since the survey began in 2010.”
Sales recovered modestly in Q3; however, volumes remained subdued, falling by 22 percent year-on-year.
Meanwhile, Indian silver imports dropped sharply. This past May, the Indian government raised import duties on gold and silver, hoping to stem imports and support the rupee.
According to Metals Focus, the drop in Indian silver imports helped ease liquidity pressure in London.
What's Ahead for the Silver Market?
In the near term, Metals Focus analysts expect physical silver demand to remain subdued. Along with lower investment demand, the higher silver price is weighing on jewelry sales. It is also driving thrifting and substitution in industrial applications.
Silver has been in a structural market deficit for five years, meaning demand has outstripped mining and recycling output. Last year, demand outstripped supply by 40.2 million ounces (1,250.36 tonnes). That drove the 5-year market deficit to 716 million ounces. For perspective, total silver mining output last year was 846 million ounces.
With demand under pressure, Metals Focus expects the market deficit to ease further this year and flip to a surplus in 2027. This reduces the likelihood of another squeeze.
Metals Focus analysts say against this backdrop, silver will likely continue taking cues from gold over the next 12 months.
“With ongoing headwinds from rising interest rates and yields, precious metals are expected to remain under pressure in the near term, with silver’s higher beta suggesting scope for further underperformance relative to gold.”
However, Metals Focus has a more bullish long-term outlook.
“Once markets scale back expectations of aggressive monetary tightening in 2027, silver could start to outperform, as renewed upward price momentum encourages investors to rebuild their exposure.”
At that point, we can expect the gold-silver ratio to snap back to the mean once again.
For technical analysts, Colombo noted that the gold-silver ratio appears to be setting up a triangle pattern, a common occurrence when asset prices pause and consolidate.
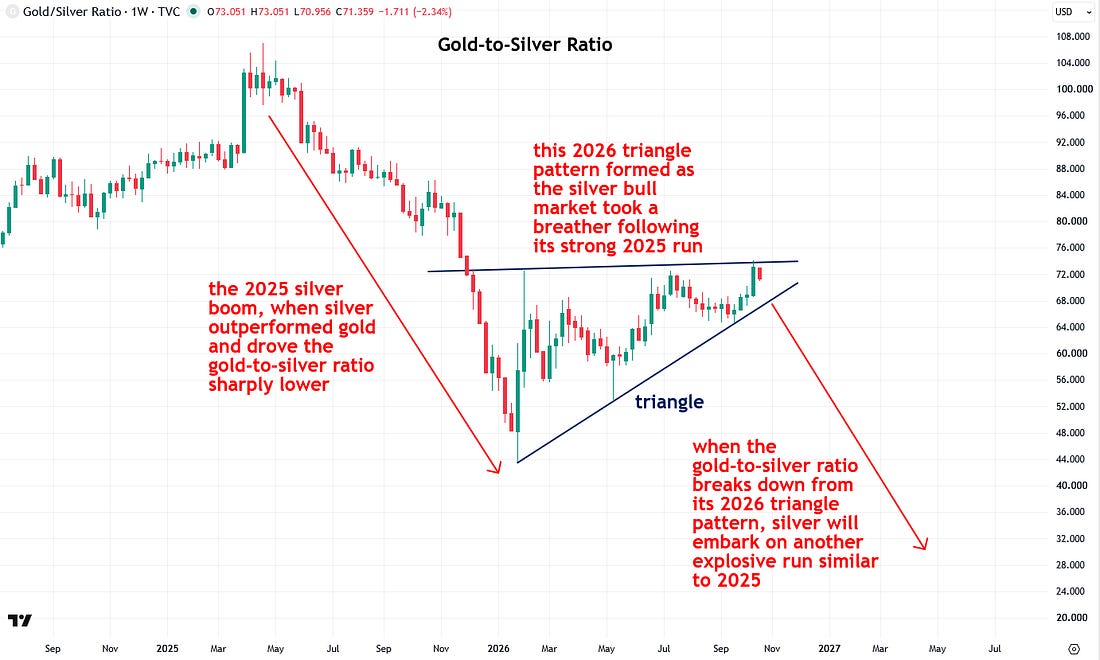
“In technical analysis, triangle patterns often act as continuation patterns, meaning that once the necessary consolidation or cooling-off period has run its course, the original trend resumes in the same direction, setting the stage for a repeat of the prior move.”
Colombo said that when this pattern breaks down, he expects it will kick off the next phase of the bull market. At that point, silver will likely surge back to its record high of $121 and beyond.


Comments
Log in or sign up to join the conversation.