


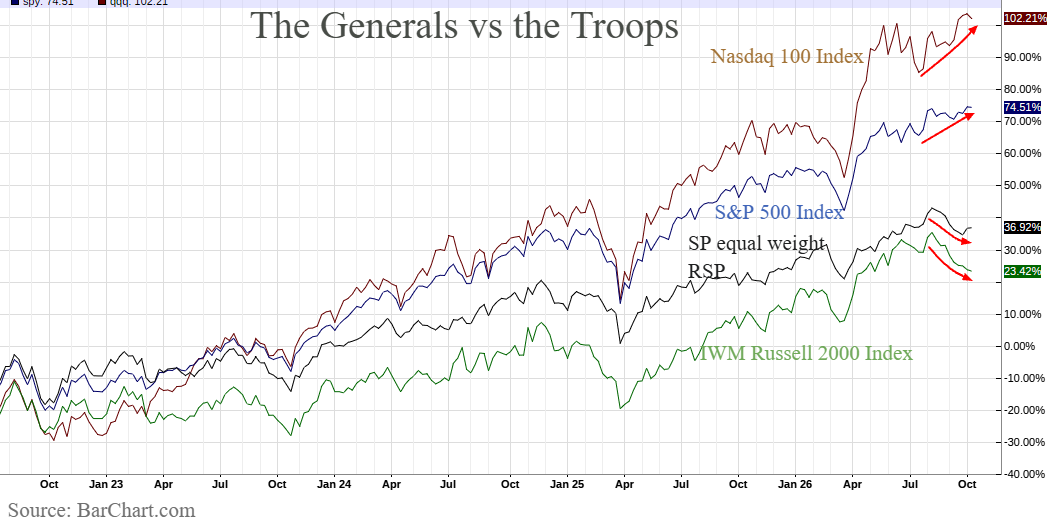
There is something farcical about a stock market in which nearly half the soldiers are nursing wounds, retreating or already occupying bear-market territory, while a handful of generals continue marching triumphantly toward new heights. Yet such is the peculiar spectacle of Wall Street in October 2026. The S&P 500and Nasdaq reached new record highs last week and remain within striking distance of more victories, while much of the broader equity market has spent recent months behaving as though the bull market ended without bothering to inform the media.
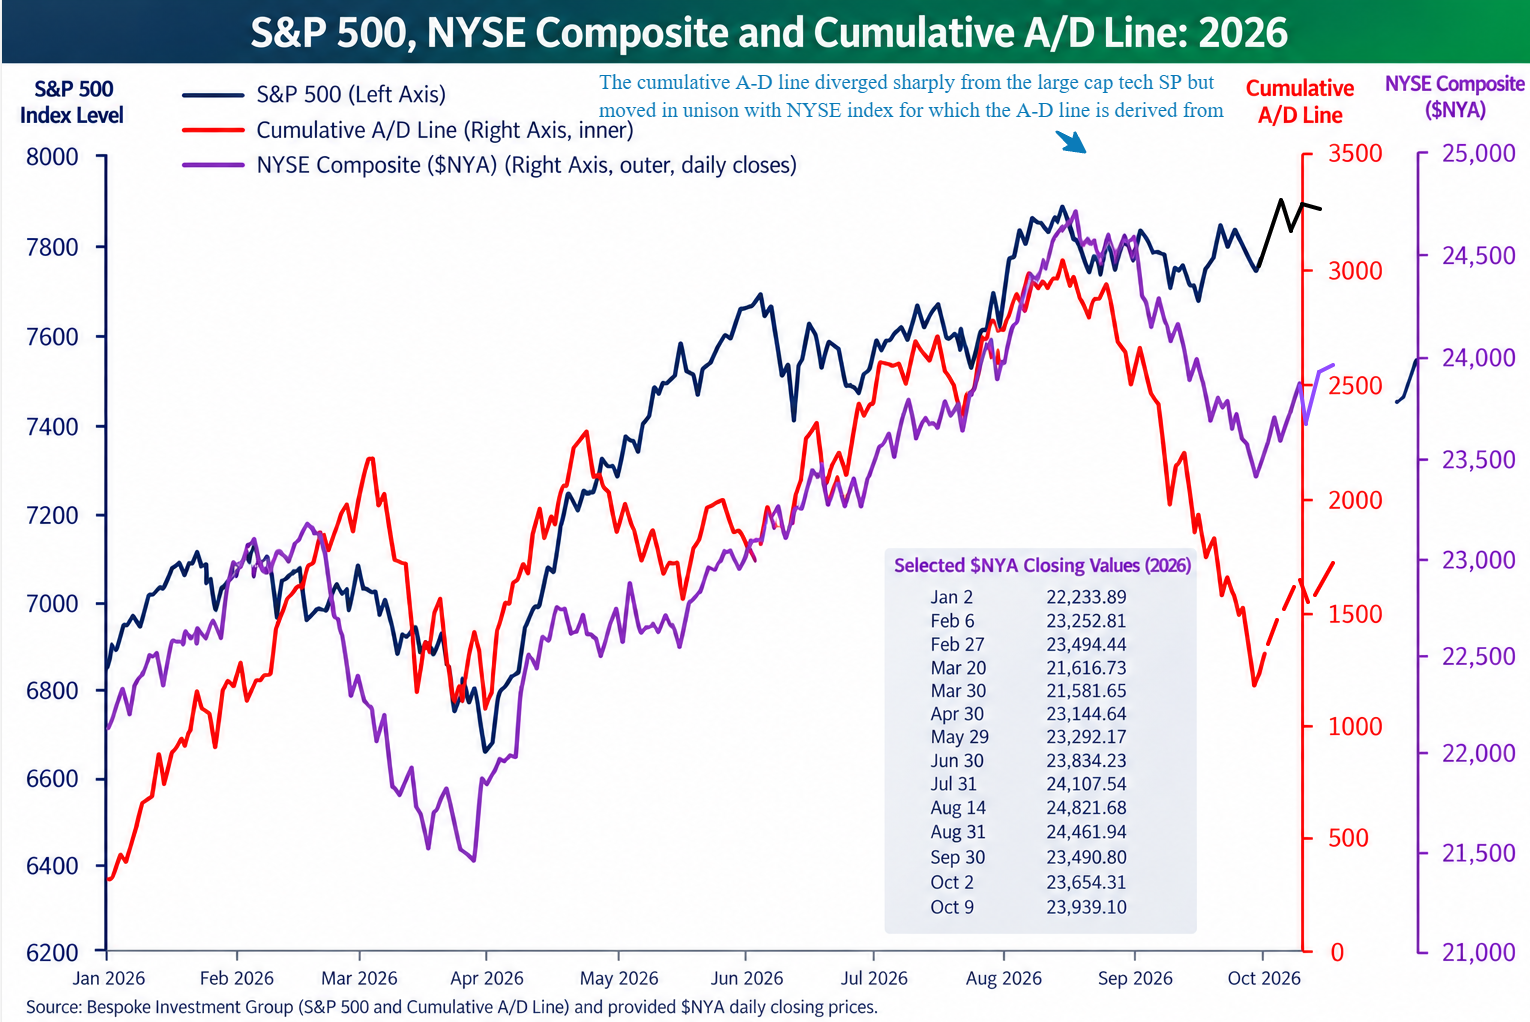
The artificial-intelligence revolution continues to generate extraordinary sales, earnings and capital investment. But outside its increasingly select circle of beneficiaries, investor enthusiasm is considerably harder to locate. The popular diagnosis is that deteriorating market breadth is flashing an ominous warning. The cumulative Advance–Decline Line has plunged over the past two months while the headline indices have scarcely surrendered their gains. To some technicians, this divergence suggests a bull market approaching its final act.
But before declaring that the sky is falling, it might be prudent to determine whether the sky and the barometer are measuring the same atmosphere.
The Advance–Decline Line: A century-old indicator frequently asked the wrong question
The origins of market-breadth analysis reach back a century to 1926, when Colonel Leonard Ayres, an economist and pioneering market statistician, began calculating and analyzing advancing versus declining stocks. His work helped establish one of Wall Street’s most enduring technical indicators. The arithmetic is simple. Each trading day, the number of declining stocks is subtracted from the number advancing, and the result is added to the previous day’s cumulative total.
Its weakness is not mathematical but interpretive. The widely quoted NYSE Advance–Decline Line measures participation among more than 2,200 listed issues. Yet commentators routinely compare it with the S&P 500 or Nasdaq, whose constituent population, sector concentrations and capitalization weightings are profoundly different. This is rather like measuring the progress of an infantry regiment and comparing it with the performance of an aircraft carrier. Both belong to the same military, but their daily outcomes need not coincide.
The S&P 500 is capitalization-weighted and increasingly dominated by enormous technology enterprises. The NYSE A/D Line, by contrast, gives each advancing or declining issue essentially one vote, regardless of its economic importance. Consequently, when the NYSE A/D Line collapses while the S&P 500 approaches record highs, the divergence reveals market concentration, but does not necessarily predict an imminent collapse.
A more appropriate initial comparison is between the NYSE Advance–Decline Line and the NYSE Composite Index (NYA), whose constituents substantially overlap the breadth universe. The comparison is not perfect—the NYSE Composite remains capitalization-weighted, and some breadth datasets include securities outside its constituent universe—but it avoids the more fundamental mismatch. And that distinction changes the interpretation of today’s market considerably.
A divergence that looks less apocalyptic under examination
From its August 14 closing high, the NYSE Composite declined over 5% by September 30. Over roughly the same period, the NYSE cumulative A/D Line suffered a much more dramatic deterioration, while the S&P 500 remained comparatively close to its highs. Viewed exclusively against the S&P 500, the breadth collapse appears alarming. Viewed against the NYSE Composite, however, the direction of the decline is hardly mysterious. NYSE prices have been falling while fewer issues have advanced than declined.
The greater magnitude of breadth deterioration still warrants attention, but the two measures are directionally consistent. A falling Advance–Decline Line accompanying a falling underlying index is evidence of weakness already occurring, not necessarily a prophecy of weakness yet to come. Breadth deterioration can precede major corrections, but it can also accompany ordinary corrections and rotations that eventually resolve with renewed advances. The technician who treats every divergence as a forecast of catastrophe will eventually be correct. Unfortunately, he may miss several profitable years waiting for vindication.
The AI generals and their reluctant army
By our broad-market measures, roughly half of S&P 500 constituents and Russell 2000 stocks have experienced declines of 20% or more from their respective highs, or are trading below their 200-day moving averages. These separate measures illustrate the considerable corrective damage beneath the headline indices. Yet this concentration has an economic explanation that should not be dismissed merely because it offends the instincts of market technicians.
The AI revolution is now entering its fifth year as a dominant investment theme. Its influence extends far beyond semiconductor designers into memory manufacturing, fiber-optic networks, electrical infrastructure, power generation, cooling systems and the immense data centers being constructed. These enterprises are generating extraordinary revenue growth, expanding earnings and accumulating enormous backlogs.
The AI buildout has also become an increasingly important contributor to American business investment and economic growth. Investors are rewarding companies producing the strongest incremental earnings growth, while withholding enthusiasm from businesses confronting higher financing costs, energy inflation and less compelling growth prospects.
A notable feature of this bull market is that forward price-to-earnings multiples of some leading AI companies have contracted even as their share prices have advanced. Earnings expectations have risen faster than valuations. A stock can become more expensive in dollars while becoming less expensive relative to anticipated profits. That is not the usual anatomy of a speculative bubble approaching exhaustion. It is, however, a market increasingly dependent upon those earnings forecasts proving correct.
The valuation paradox: An expensive index containing an inexpensive market
The S&P 500 commands a premium multiple, reflecting the extraordinary profitability and expected growth of its largest constituents. Yet many stocks within the broader market are considerably less expensive. Investors are paying generously for growth they can see and demanding substantial discounts for growth they cannot.
This helps explain why narrow market breadth is neither inherently bullish nor bearish. It describes the distribution of returns, not necessarily their future direction. Narrowing participation accompanied by collapsing earnings, widening credit spreads and deteriorating liquidity would spell trouble. Narrowing participation accompanied by robust earnings among market leaders, comparatively modest valuations among laggards and a resilient consumer presents a different proposition. The present environment appears closer to the latter, although persistent energy inflation and elevated interest rates remain meaningful threats.
The missing ingredient for broader participation: Lower oil and lower interest rates
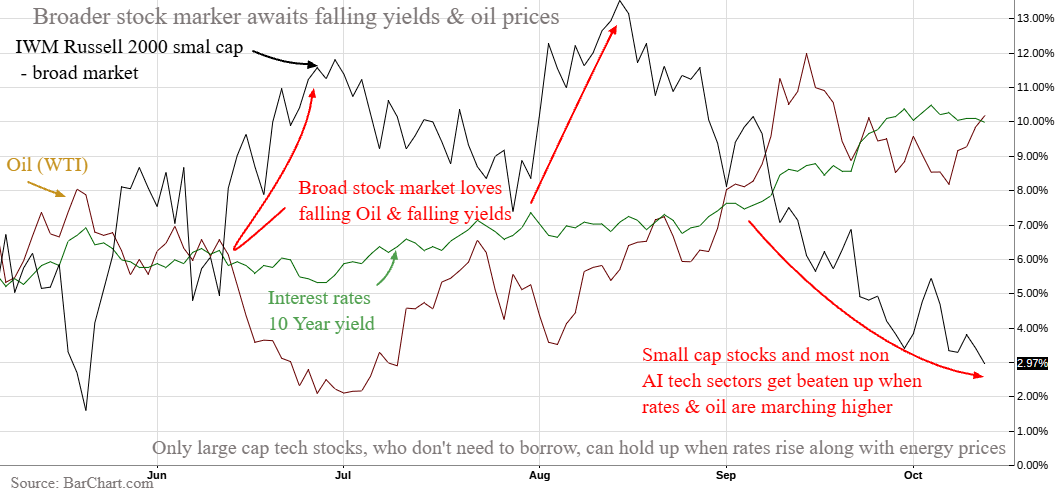
The remainder of the market is not necessarily suffering from a shortage of profits, attractive valuations or prospective buyers. It is suffering from a shortage of financial oxygen. Higher Treasury yields raise the cost of capital, penalize leveraged businesses and diminish the relative appeal of equities. Higher energy prices act as an additional tax on consumers and industry, while persistent inflation compels the Federal Reserve to tighten credit conditions.
The result is a market divided between large cap tech enterprises whose earnings growth and self financing can overcome these headwinds and those whose fortunes remain more sensitive to the economic cycle. Many small-cap, mid-cap, financial, industrial and consumer-oriented companies trade at comparatively modest valuation multiples. Their technical condition is mildly oversold, and investor sentiment toward them resembles defensive resignation more than speculative enthusiasm.
This is potentially fertile ground for a rotation. But investors need a catalyst, and the most persuasive would be a sustained decline in crude oil prices accompanied by falling Treasury yields. Such a combination would improve corporate margins, ease inflation expectations, reduce financing pressures and expand the universe of company stocks capable of attracting investment capital.
The broad market does not need the AI generals to retreat. It needs the rest of the army to discover that advancing is once again economically rewarding. Until Iran and its proxies can be tamed, Oil and diesel prices will stay painfully high, especially after factoring in the extreme insurance and shipping costs. Until AI related supply chains can begin to loosen, inflation and borrowing costs will increasingly brake the economy.
October’s surprise: A geopolitical contest over the price of energy
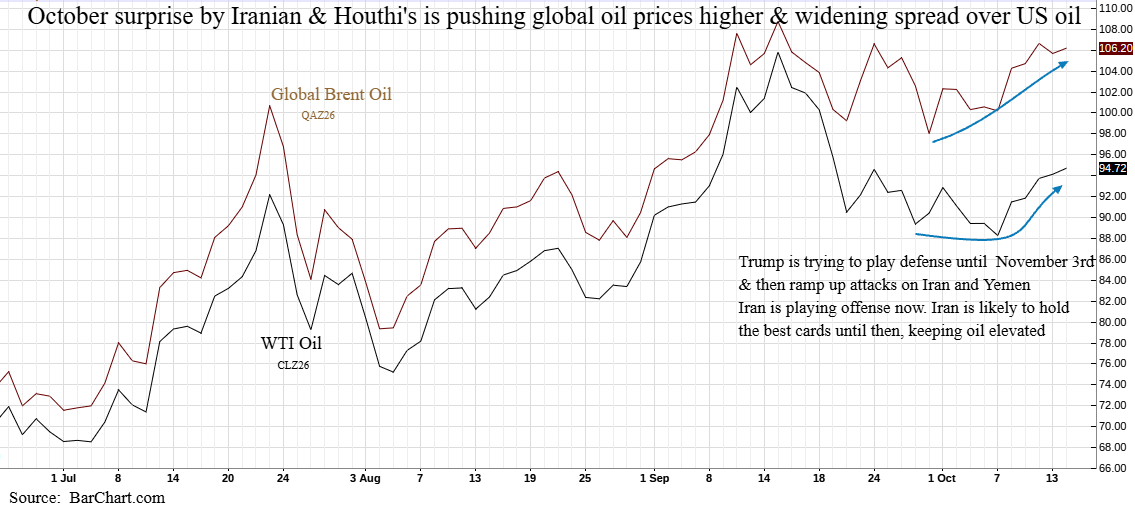
The much-anticipated October surprise has thus far been less a single dramatic event than an increasingly consequential contest of geopolitical endurance. With the November 3 midterm elections three weeks away, Washington has powerful political incentives to contain energy prices and reduce the economic consequences of military confrontation with Iran. Trump’s apparent preference for de-escalation confronts an Iranian leadership with incentives to escalate the conflict and cause havoc with the global energy market. The danger extends beyond the Strait of Hormuz to the Red Sea, where Iranian-aligned Houthi forces retain the ability to threaten commercial shipping and regional infrastructure, such as Saudi Arabian civil and energy structures.
Even if the physical volume of crude oil reaching international markets approaches normal levels, the economic consequences of disrupted shipping are not necessarily normal. War-risk insurance, freight charges, longer voyages and security costs impose premiums on oil and related shipments. For some routes and products, the combined economic burden can resemble crude oil prices well above $100 per barrel, even when benchmark futures trade below that level. The true cost of oil is estimated to be 15 to 30% above the quoted price.
For now, the competing American and Iranian strategies appear to be producing an uneasy stalemate with WTI Oil in the low to mid $90’s and global Brent about $10 higher. Once the political constraints of November 3 have passed, the administration may have greater latitude to intensify military operations against Iranian targets or support Saudi and Yemeni efforts against Houthi forces. Most expect Oil to fall after the elections, yet that may be postponed by a sharp increase in US military strikes.
That is a plausible scenario, not a predetermined outcome. Renewed escalation could prolong the very energy premium investors desperately want removed. The critical variable is not simply whether additional military strikes occur, but whether their consequences raise or lower the cost of transporting and consuming energy. The bond market, which is generally unimpressed by political assurances, will be watching closely.
Investor sentiment: A bull market without universal enthusiasm
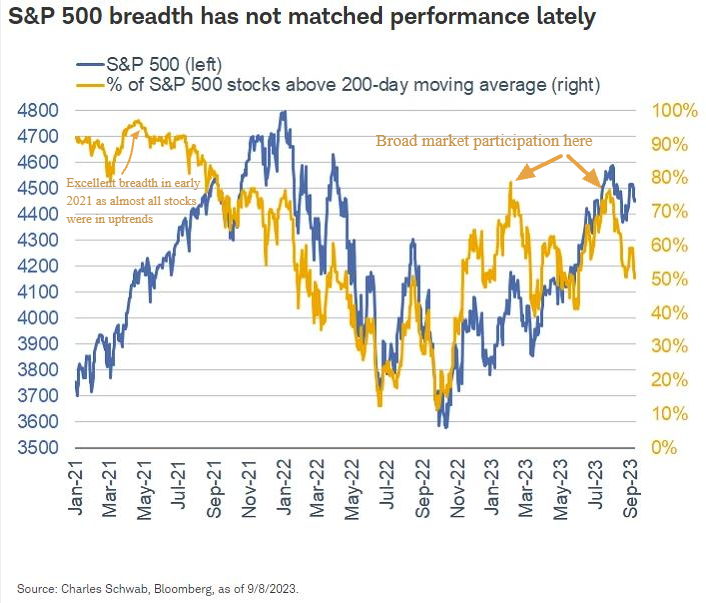
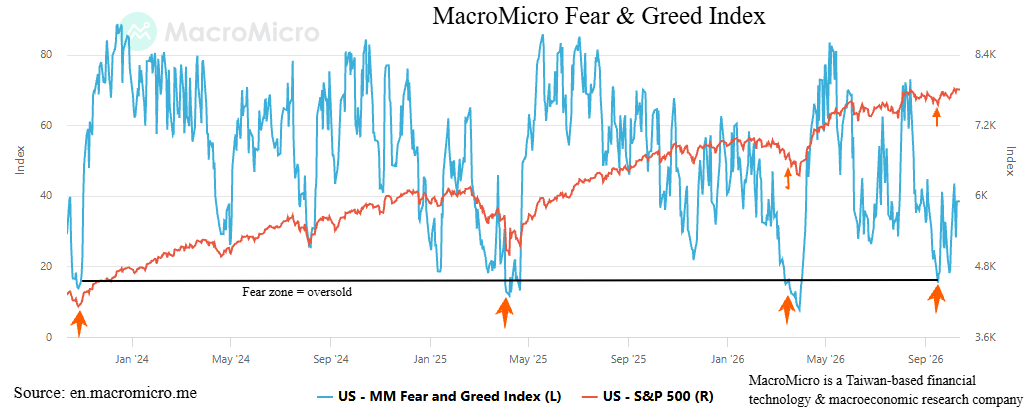
Another reason to resist the most dire interpretations of market breadth is the absence of widespread speculative euphoria. Today’s market combines concentrated enthusiasm in a few stocks with broad indifference. AI-related leaders command attention and earnings growth, while much of the remaining market trades with little evidence of investor excitement. This is hardly the indiscriminate enthusiasm characteristic of the most dangerous speculative extremes.
Our interpretation of the technical evidence is that the broader market is mildly oversold, while dominant growth companies range from reasonably valued to moderately expensive relative to their earnings prospects. The consumer, meanwhile, has proved more resilient than repeated forecasts of exhaustion would suggest. The most recent Chase credit card data shows that consumer spending has been growing at a strong 5.3% year over year rate the past 7 months, accelerating to 6.6% in September. Higher gas prices are a part of the higher spend, but the bankers conclude that even excluding energy inflation, that the consumption trends are robust. This is a strong economy, despite the political pessimism that pervades consumer sentiment surveys
Investors have become selective rather than universally pessimistic. That selectivity could become a source of considerable buying power should the inflation and interest-rate outlook improve. Investors who have spent months hiding in the earnings certainty of AI leaders may discover that the next attractive opportunity lies among neglected companies whose share prices are off 10% and have already absorbed substantial pessimism.
The bull market is wounded, not defeated
At the four year anniversary of this secular AI bull market, the balance of evidence continues to favor the bulls. The major benchmarks remain close to their highs. Corporate earnings among large cap tech leaders remain impressive. Forward valuation multiples have moderated for some of the largest winners as earnings estimates have risen. Much of the broader market has already endured substantial corrective damage and is closer to a bottom than a top. The cumulative NYSE Advance–Decline Line has deteriorated, but its weakness should not be interpreted independently of the decline already visible in the NYSE Composite and the broader universe of stocks.
The message is not that a bear market is imminent, but that the bull market remains highly concentrated, with broad participation constrained by expensive energy, elevated interest rates and geopolitical uncertainty. Those constraints could persist. Oil prices might rise further as winter energy demand increases. Inflation could prove stubborn, Treasury yields could advance, and post-election military escalation could introduce another round of uncertainty.
But the alternative deserves equal consideration.
Should the IRGC and the Houthi forces be neutralized and crude oil prices and Treasury yields begin falling together, the financial conditions suppressing broad-market participation would begin to reverse. Modest valuations, defensive investor positioning and oversold technical conditions could produce a substantial rotation into the neglected majority of American equities. The AI generals would no longer be required to carry the entire campaign.
Our investment thesis remains that the bull market is consolidating rather than concluding. The next decisive development will likely come not from another technical indicator, but from the direction of energy prices, inflation and Treasury yields. For now, investors have one hand tied behind their backs by oil and interest rates, while the other continues purchasing companies producing extraordinary earnings growth.
The bears have assembled an impressive collection of grievances. They have yet to produce the broad deterioration in earnings and economic conditions necessary to turn those grievances into a convincing case for a sustained bear market. And should oil and yields finally retreat, the most surprising development may be how quickly the market’s neglected infantry rejoins its generals.


Comments
Log in or sign up to join the conversation.