


Cem Karsan is flagging August 21, the monthly options expiration (OPEX) date, as the setup for what he calls a gamma cliff. On August 21st, one of the year’s larger concentrations of monthly options open interest will expire or roll forward. What happens next is worth watching.
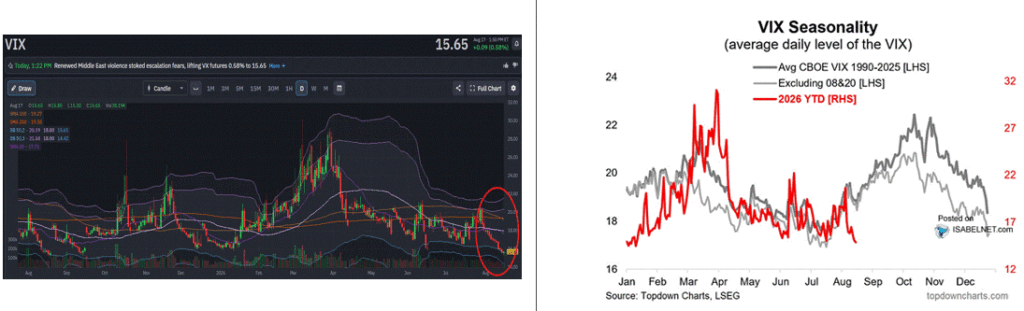
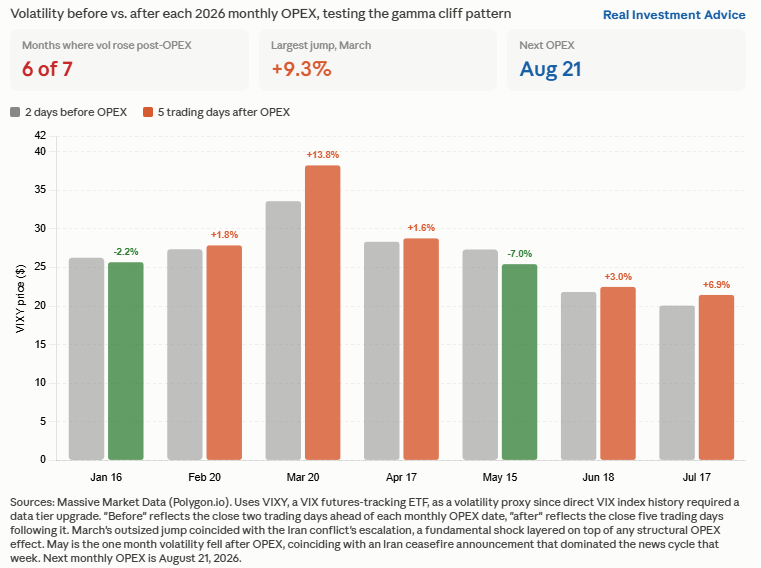
Options market makers must hedge their risk by trading the underlying stock. The aggressiveness of their hedge trading is driven by their aggregate gamma (gamma measures an option’s sensitivity to price changes as the stock moves). As option expiration nears, gamma on at-the-money contracts builds sharply, forcing dealers to trade more actively to stay hedged. That increased hedging volume dampens volatility before the OPEX gamma cliff, as they typically sell in upward markets and buy into down markets. This helps explain why the VIX has recently been trading lower heading into OPEX, as shown on the left. When the large amount of options expire or roll forward on Friday afternoon, the stabilizing hedging flows that suppressed volatility disappear. With significantly less gamma left to hedge, dealer flows have less market impact, allowing a directional trend with more volatility to develop.
Karsan’s framework adds another layer. He distinguishes between option expiration cycles dominated by call gamma versus put gamma, noting that call-heavy, positive gamma cycles, as we are currently in, have historically tended to produce “market weakness or choppy price movements in the week following OPEX.” He also describes a recurring “window of weakness,” the period after one big gamma cliff and before the next cycle’s gamma starts to have its stabilizing effect.
Also note, as shown in the graph on the right, we are in a seasonal period of rising volatility. Thus, the gamma cliff Karsan warns of may be even more significant over the next few weeks.
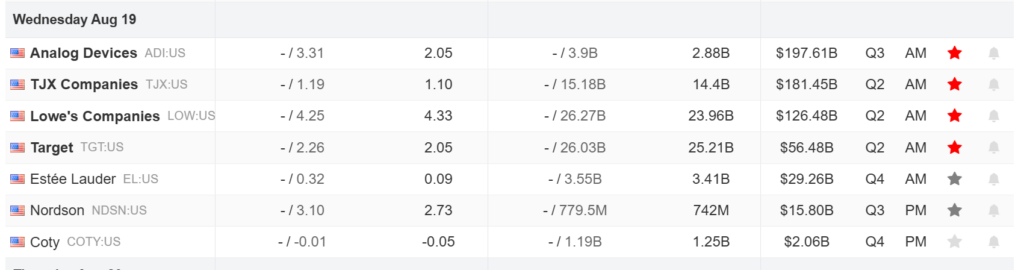
What To Watch Today
Earnings
Economy

Market Trading Update
Yesterday, we discussed how a collapse in implied correlation left the index far more fragile than a 14 handle on the VIX suggested. Today I want to flip to the other side of that trade, because the oversold bond market has stretched to a point that finally matters.
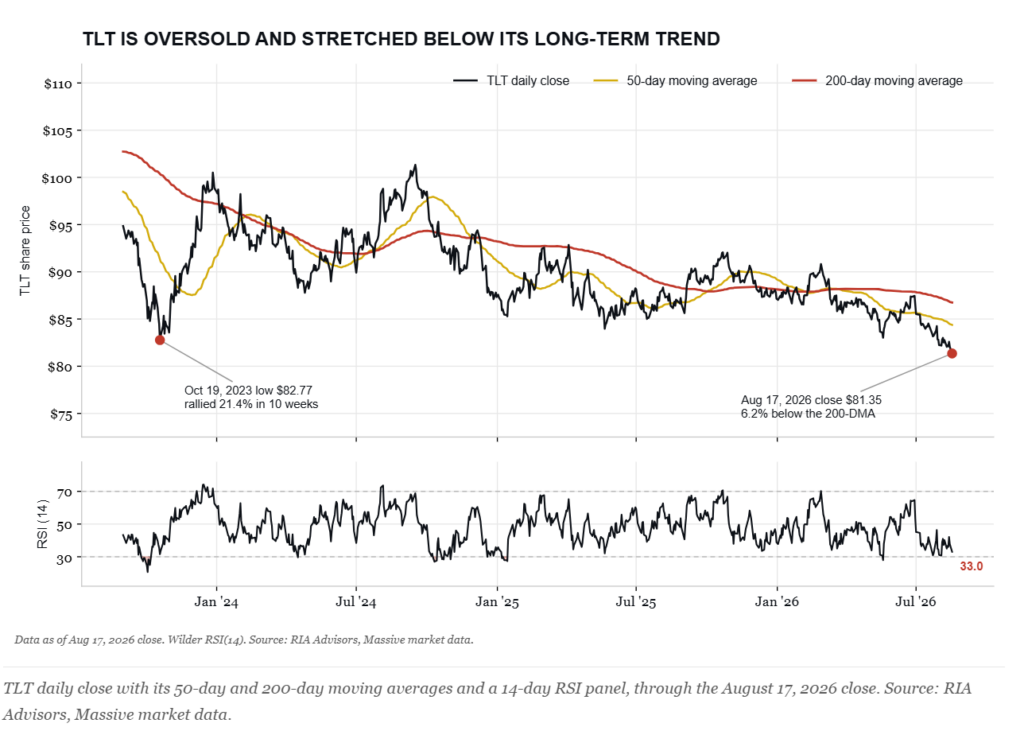
Let’s anchor it in the tape. TLT closed Monday at $81.35. That’s 3.6% below its 50-day moving average at $84.38, 6.2% below its 200-day at $86.76, and roughly 13% below its 50-month average near $93.76. Monday’s close also took out the October 19, 2023 panic low of $82.77, the bottom that preceded a 21.4% rally in ten weeks. Momentum matches the price. The 14-day RSI closed at 33.0, which sits in the bottom 7% of every daily reading over the past decade. The 10-year yield at 4.68% and the 30-year at 5.25% are each about 35 basis points above their own 200-day averages.
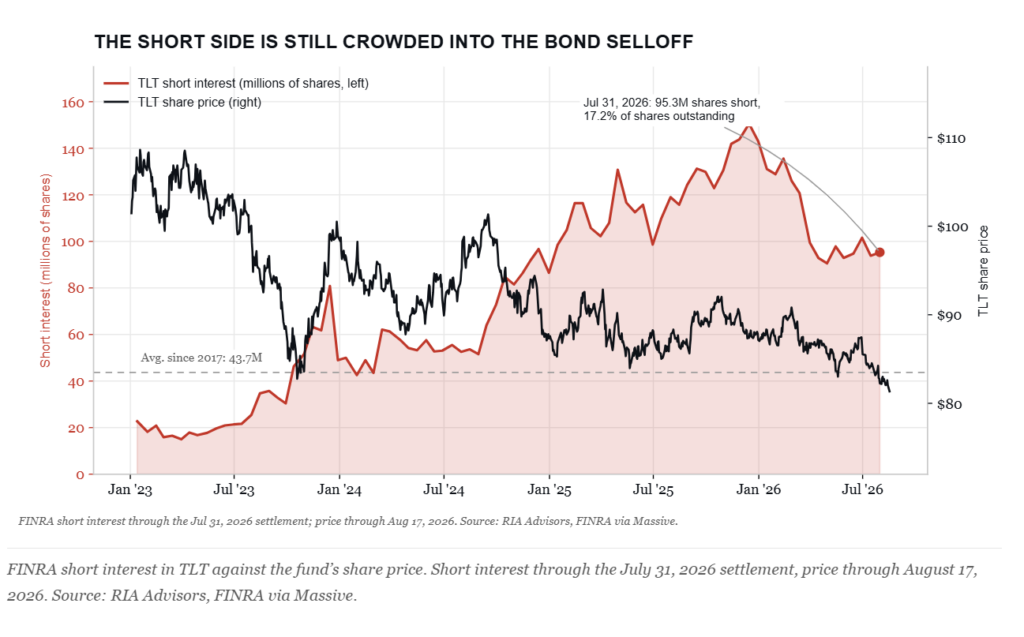
Now look at who is on the other side. Short interest in TLT stood at 95.3 million shares at the July 31 settlement, or 17.2% of shares outstanding, more than double the 43.7 million average since 2017. Roughly 68% of Monday’s off-exchange volume was short sales. Through August 11, leveraged funds carried a net short of 2.16 million ten-year note futures against asset managers holding a net long of 2.55 million. I’ll grant the counter before you make it. Much of that futures short is the cash-and-carry basis trade, NOT a directional view. The ETF short is directional, and it’s the one that has to buy.
From a contrarian viewpoint, when everyone agrees on something, something else usually happens.
Here is the honest math. Since 2016, TLT has been this oversold and this far under its 200-day average 40 separate times. The average maximum rally inside the following two months was 4.3%. 55% of those episodes produced a bounce of at least 3%, and 30% produced 5% or better. The catch is that the average episode also gave back 5.4% along the way, and the average two-month return was flat. That’s a trade, not a trend change.
Eventually, rates will create an economic revulsion, consumer spending will slow, and recession risk will rise. That will eventually end the drag on bonds. However, for retiree’s, this is the first time in 20-years where you can lock in a decent level of income and lower overall portfolio volatility.
However, for now, the setup for a bounce is ripe. I would use the bounce to rebalance portfolio allocations as needed, reduce duration if you are overweight long-duration bonds, and think through what happens when, or if, the economy breaks. That isn’t a maybe, but a “when” question.
Can The Market Continue To Fight Its Headwinds
Three separate headwinds may make it tougher for the stock market to continue higher.
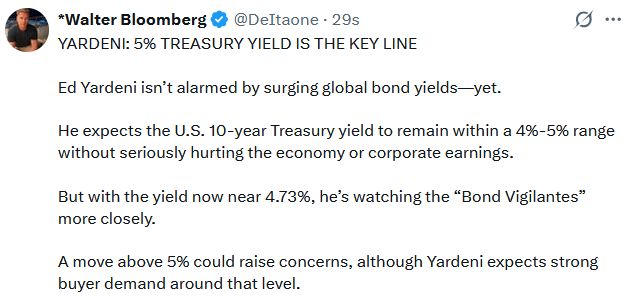
The 10-year Treasury yield is now within a few basis points of its 19-month high of 4.75%, while the 30-year yield is 5.30%, its highest level since June 2007.
Crude oil is trading back above $85, after troughing below $70 in early July. The interim US-Iran ceasefire formally expired with negotiations still deadlocked. The correlation between oil prices and yields has been strong.
The gamma cliff we noted in the opening is a third headwind that could materialize early next week. Stabilizing dealer hedging flow that’s kept volatility contained will disappear.
The market has absorbed the first two pressures so far. To wit, Piper Sandler’s Michael Kantrowitz noted equities have stayed resilient specifically because “ten-day realized volatility remains low,” and earnings growth continues trending higher. The gamma hedging, which has negated the impact of higher oil and yields, may not be as effective post-gamma cliff. As we share below, volatility has risen in 6 of the last 7 gamma cliffs.
Tweet of the Day


Comments
Log in or sign up to join the conversation.