


🏛️ Market Brief – Earnings Season Opens On A Raised Bar
The market sold off hard to finish the week. The S&P 500 fell 1.09% on Friday to 7,659.44, closing the week down 1.95%, its worst week since June. The Nasdaq Composite fared worse, dropping 2.15% Friday and 4.48% for the week. Meanwhile, the Dow eked out a 0.67% weekly gain, and the Russell 2000 lost 3.05%. That split tells you most of what you need to know about what happened: there was a continued rotation from growth and risk to value and safety.
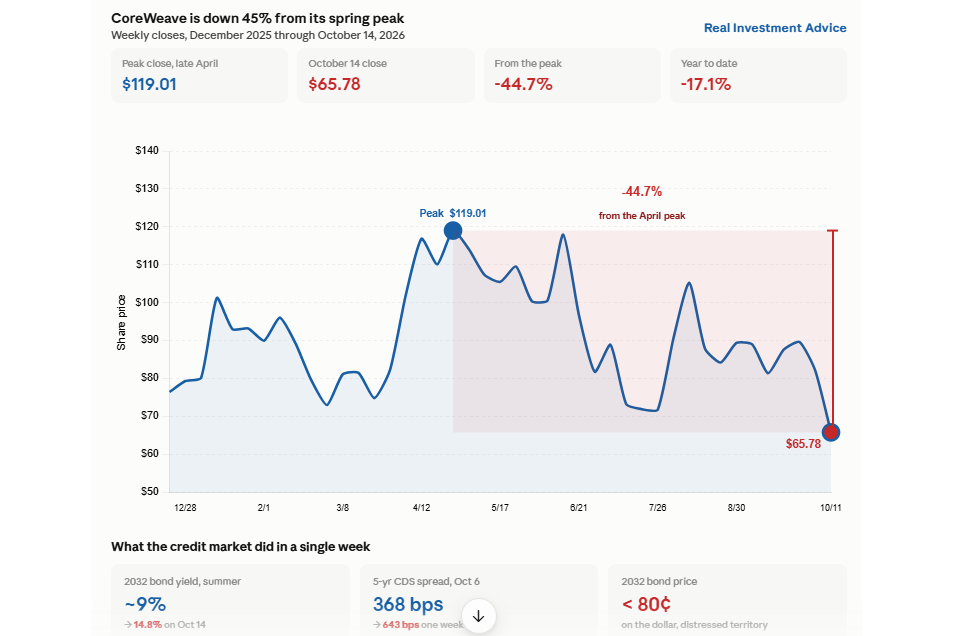
The selling was concentrated and professional. The trigger was a scare about how the AI buildout would be financed. CoreWeave lost a quarter of its value this week, with its bonds yielding above 15%, and that gave investors an excuse to dump anything “AI-adjacent.” The semiconductor ETF (SMH) fell 10.5% on the week. Lam Research (LRCX) dropped 17.2%, Micron (MU) 14.6% and Intel (INTC) 14.2%. Per Goldman Sachs prime brokerage data, hedge funds net sold global AI stocks for five straight sessions, unwinding every dollar of net buying since early 2025. Long sales outpaced short sales roughly 3.5 to 1, so this was “de-risking,” not a new bet against the market.
The macro backdrop didn’t help. Hotter consumer and producer inflation reports pushed the odds of a December rate hike to 74.3%, as Fed Chair Warsh argued that a spending surge (read: Capex) is fueling inflation. Brent crude jumped 3.7% on Friday to $109.86 with no deal in sight on Iran. The VIX climbed to 20.16 from 14.84 a week ago. Of course, when dollars look for safety, there is nothing as good as Treasury bonds. The rotation from risk to safety showed up in the 10-year yield falling to 5.09% from 5.24%.
Here is the part the headlines missed. It was NOT a liquidation of everything. Staples rose 5.0%, energy 4.9%, and health care 3.5%, and the equal-weight S&P 500 actually gained 0.5% while the cap-weighted index fell 2.0%. As we warned in last week’s Bull Bear Report, technology was extremely extended above its long-term mean, and a growth-to-value rotation looked likely into year-end. That rotation arrived faster than expected. Bob Farrell’s Rule #2 says excesses in one direction lead to an opposite excess in the other, and a crowded AI trade is unwinding the way crowded trades always do.
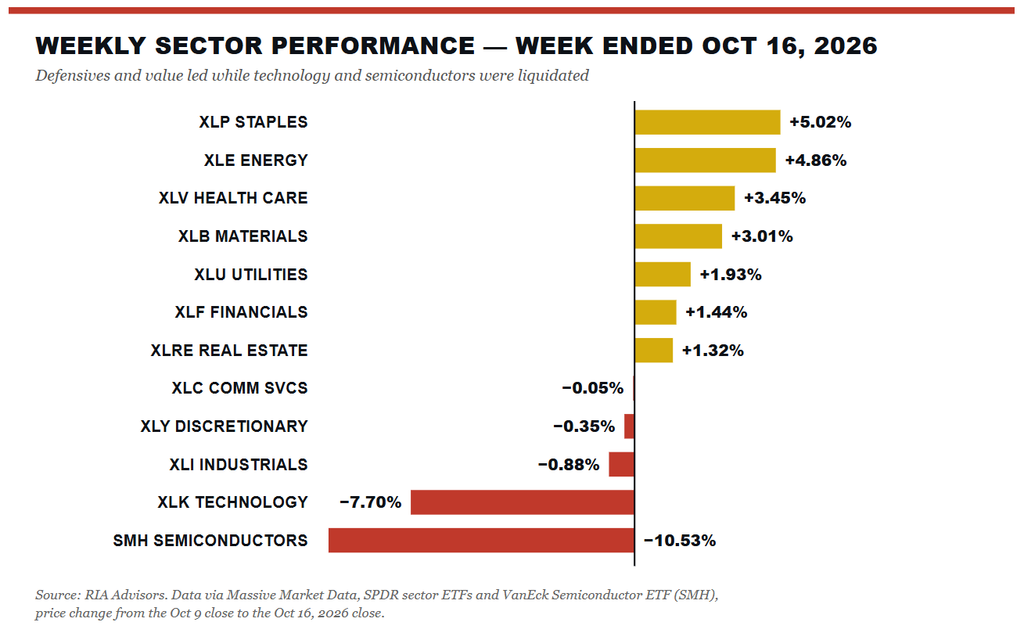
Does that set up a rally? Possibly. Positioning is cleaner, and Goldman puts hedge fund AI allocation at 26.1%, down from 31.7% in June. But the same Goldman note says this deleveraging is “closer to its beginning than its end,” with gross leverage still near five-year highs, of course, that note was before Friday’s selloff.
Next week, earnings will be the swing factor. FactSet reports that 84% of companies have beaten estimates so far, yet the market is selling beats by 0.2% on average versus a normal 0.9% gain. The bar is high. Magnificent 7 earnings are expected to grow 33.2%, but excluding Nvidia (NVDA) and Meta (META), that drops to 7.5%.
That makes next week’s reports, particularly Meta on Wednesday, the real test. The thread to follow is whether the rotation stays a rotation. If defensives and value continue to catch bids while tech stabilizes, a reflexive bounce is likely. If the selling spreads into the equal-weight index, the problem is bigger than AI.
📈Technical Backdrop – MACD Turns Up Just Below The Record
The S&P 500 closed Friday at 7,659.44, down 1.95% for the week and 2.0% below the October 6 record close of 7,818.93. More importantly, the index closed below its 50-day moving average (7,712) for the first time since September 30. It remains 5.3% above the 200-day moving average (7,276), so the longer-term uptrend is intact. The short-term trend is not.
Last week, we said a close below 7,700 would shift the near-term trend to neutral. That happened. Momentum confirmed it. The 14-day RSI fell to 43.8 from 59.9 a week ago. The MACD crossed below its signal line on Thursday, reversing last week’s buy signal. That’s a sell signal, but from a level that is far from oversold.
The Bollinger Bands frame the setup. The index now sits 1.47 standard deviations below its 20-day mean of 7,739, just above the lower 2 SD band at 7,631. Notice in the chart below that each of the last three closes below that lower band, on June 10, July 29 and September 16, marked a short-term low within a few sessions. The lower 3 SD band at 7,577 lines up almost exactly with the September 16 low of 7,567. That is the line in the sand.
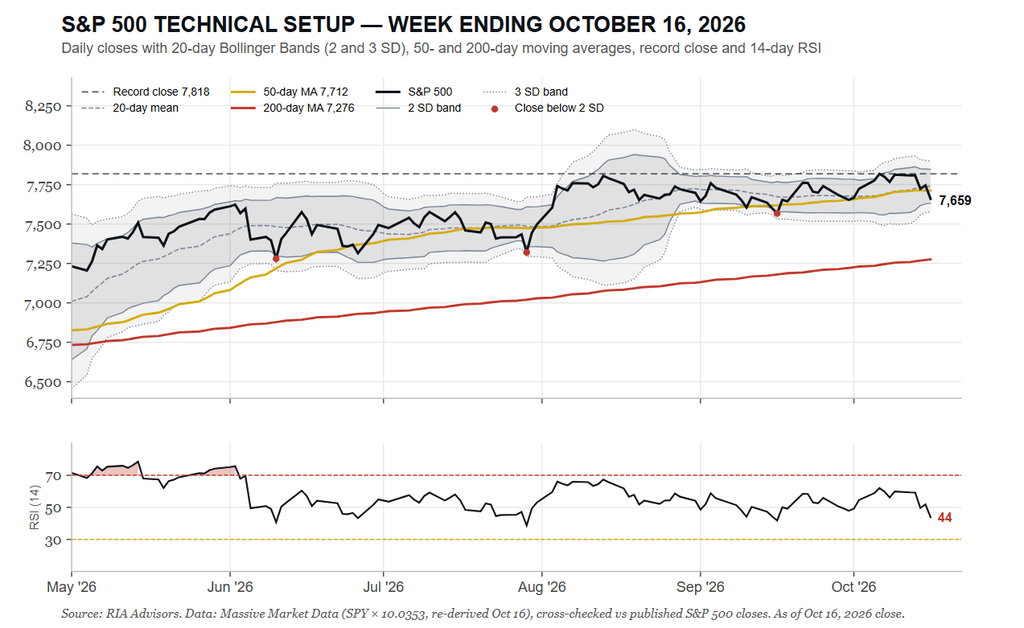
Breadth is the saving grace. The equal-weight S&P 500 rose 0.5% while the cap-weighted index fell 2.0%. Even late in Friday’s session, roughly 228 of the 500 members were higher on the day. The damage is in the largest names. Such is the difference between a rotation and a market where everything breaks at once.
On positioning, we made no trades this week. Two weeks ago, we trimmed technology exposure and added to value. We also harvested tax losses and rebalanced bond portfolios, slightly shortening duration to capture higher yields. That rotation did its job this week.
Don’t sell into the hole. A reflex rally toward the 50-DMA and the 20-day mean (7,712 to 7,739) is likely. Use it to rebalance rather than chase. A close below 7,567 is the signal to raise cash and add hedges. Below that, the 200-DMA near 7,276 is the next major support. Until Wednesday’s earnings clear, keep technology positions at or below target weights.
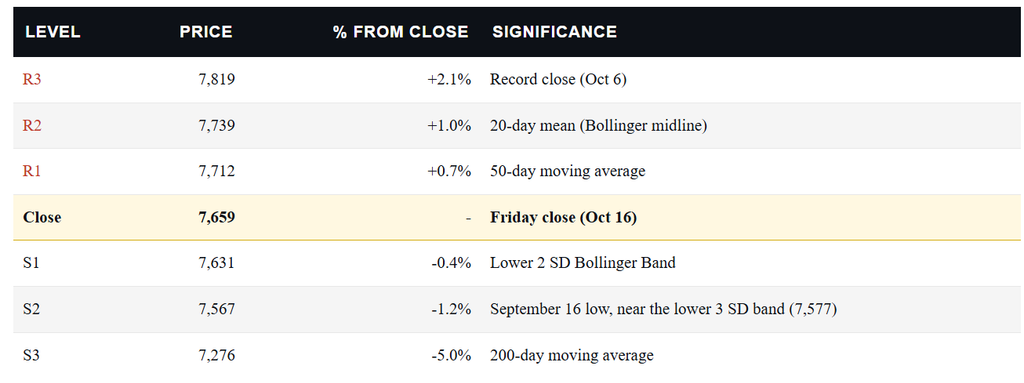
The single most important level next week is 7,567. Hold it, and this is a pullback inside an uptrend that sets up a tradeable bounce. Lose it on a closing basis, and the market is telling us the AI unwind has further to run.
🔑 Key Catalysts Next Week
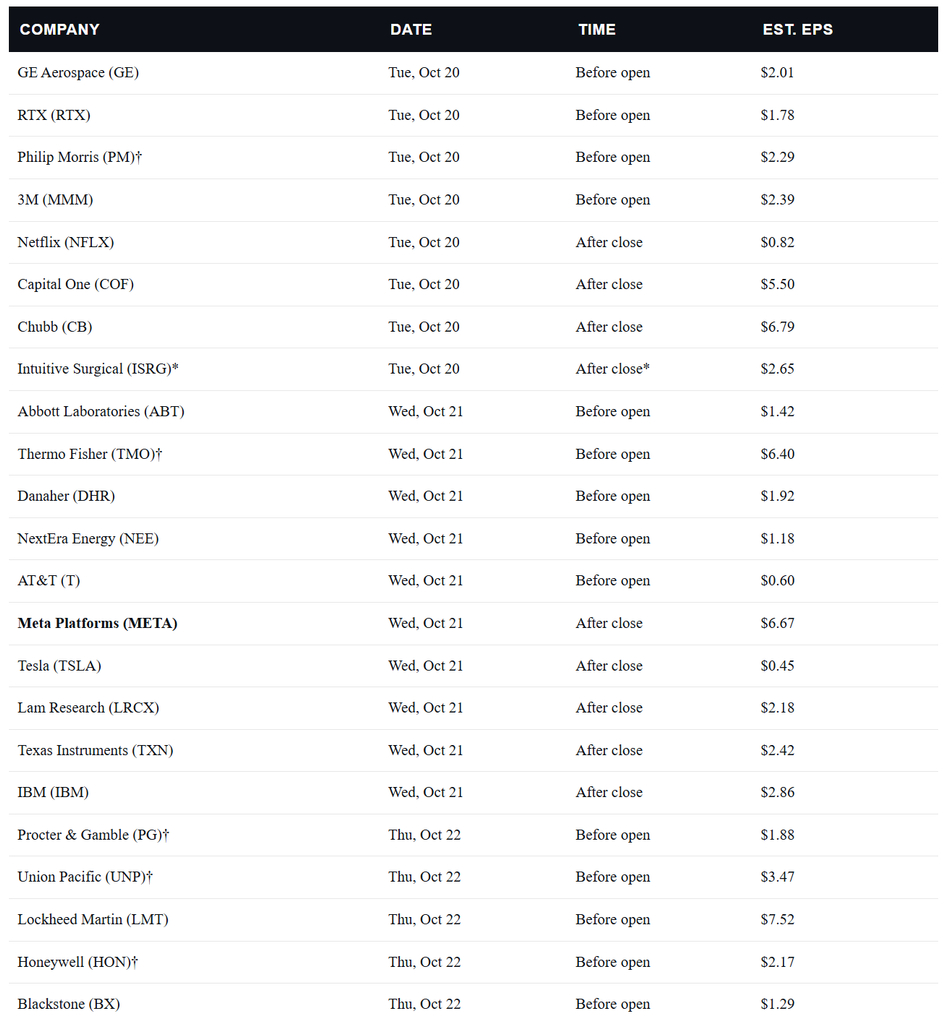
Next week is when earnings season gets serious. According to FactSet, 79 S&P 500 companies report, including five Dow components. After this week’s AI liquidation, the question those reports will answer is simple: was the selling driven by fundamentals or by positioning?
Wednesday after the close is the week. Meta, Tesla (TSLA), Lam Research, Texas Instruments (TXN) and IBM (IBM) all report after the bell, which means five of the most AI-sensitive names in the market will deliver their verdicts in a single evening. Meta carries the most weight. It’s one of only two Magnificent 7 names doing most of the group’s heavy lifting. Its capital spending guidance will be read as a verdict on whether the AI buildout can keep financing itself with yields above 5%. Lam Research, down 17.2% this week, gives the semiconductor equipment read. Texas Instruments covers the industrial and analog cycle that the AI trade left behind.
The rest of the calendar leans toward the “old economy” that just outperformed. Netflix (NFLX), GE Aerospace (GE), RTX (RTX), and Capital One (COF) report Tuesday. Procter & Gamble (PG), Union Pacific (UNP), Lockheed Martin (LMT), Honeywell (HON) and Blackstone (BX) follow Thursday. Exxon Mobil (XOM) and American Express (AXP) close out the week Friday. If staples, industrials, and energy confirm their earnings strength, the rotation out of tech has a fundamental leg to stand on.
The economic calendar is light. Housing starts, building permits and pending home sales arrive Tuesday, with weekly jobless claims and the leading economic index Thursday. Friday brings the flash S&P Global PMIs and the final University of Michigan survey. Its one-year inflation expectations number matters more than usual after this week’s hot CPI. Watch Wednesday’s $13 billion 20-year Treasury auction too. A weak bid could push yields right back up after this week’s flight to Treasuries.
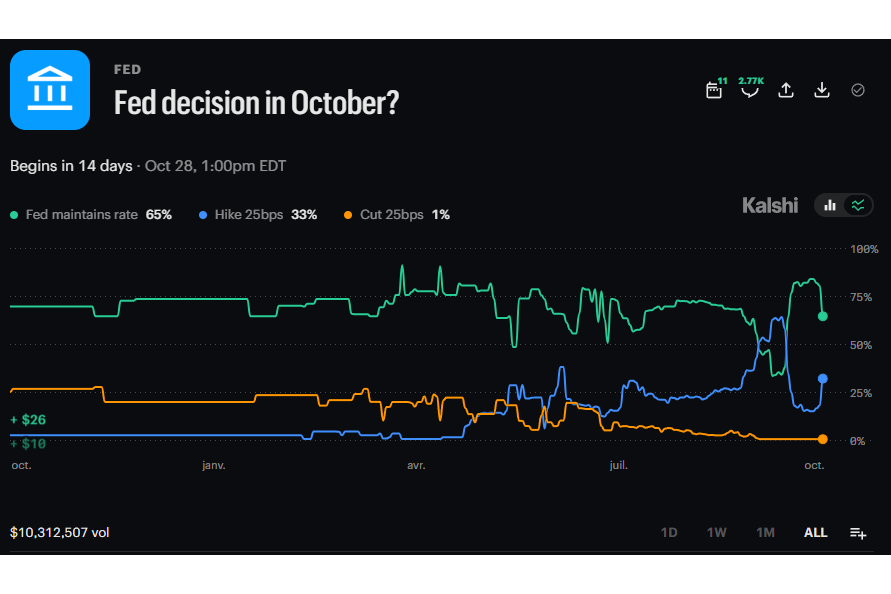
The Fed enters its quiet period on Saturday ahead of the October 27-28 meeting, so there are no scheduled Fed speakers. Markets now price a 74.3% chance of a December hike. Oil remains the wild card, with Brent near $110 and no resolution on Iran or the Strait of Hormuz.
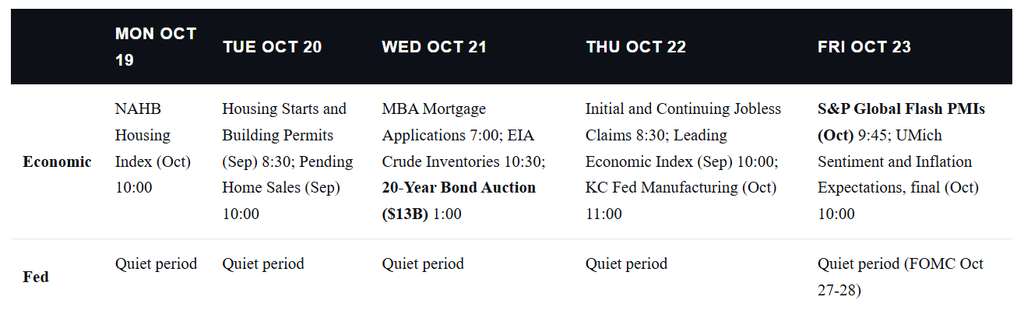
The most market-moving event of the week is Meta’s report Wednesday night. The asymmetry is clear. A capex raise paired with a clear financing plan could spark a sharp short-covering rally. Positioning in the sector has already been cleaned out. A cut, or any hint that funding is getting harder at 5% yields, would hand the AI bears their next leg down.
💰 Pimco Sees A 6% 10-Year. Here’s Why “Bad Inflation” Caps Yields
Will interest rates go up to 6%? That’s the question on many investors’ minds since Pimco’s chief investment officer, Dan Ivascyn, told the Financial Times last Friday that a 6% 10-year Treasury yield is “certainly possible.” This week’s hotter-than-expected September CPI report only added fuel to that argument.
I get it. The 10-year closed at 5.31% on October 5, the highest close since May 2002. It started the year at 4.18%. However, look at what is actually driving inflation. Then look at how every major yield spike since 1990 ended. The case for a sustained move to 6% gets thin quickly.
Pimco’s 6% Call, And Why It Landed
In case you didn’t read the article, let’s start with what Ivascyn actually said, because the headlines compressed it. He did not forecast 6%. He said it was possible, and he tied a big part of the recent move to market plumbing rather than economics.
“It is certainly possible, even from a short-term trading perspective… some of the activity we’ve seen in the last couple of weeks is tied to some negative technicals.”– Dan Ivascyn, Pimco, to the Financial Times, October 9, 2026
Furthermore, he also flagged “stop-out activity from the platform hedge funds and other levered investors,” and warned that a move to 5.5% or higher would bring “some decent weakness in risk markets, both credit and equity.”
Read that last part twice, because I’ll come back to it, and it was a topic we touched on when we discussed the “Basis Trade.” The backdrop is real. Oil has spiked. The Fed raised rates in September for the first time since 2023. And today’s CPI showed headline inflation accelerating to 3.7% from 3.4% in August.
Such is the setup that makes a 6% call feel inevitable. But a forecast that depends on forced selling by levered funds is a forecast about positioning, and positioning reverses. When the “technicals” that drove a move wash out, the fundamentals reassert themselves. So the real question for investors is what the fundamentals say.
Will Interest Rates Go Up On Inflation? Look Under The Hood
The bond bears’ case rests on inflation. So let’s look at inflation. The Bureau of Labor Statistics reported this morning that the energy index rose 20.4% over the past year, with gasoline up 34.2%. Gasoline alone rose 9.1% in September. Strip out food and energy, and core CPI rose 2.6% over the year. A year ago, that same core rate was running at 3.0%.
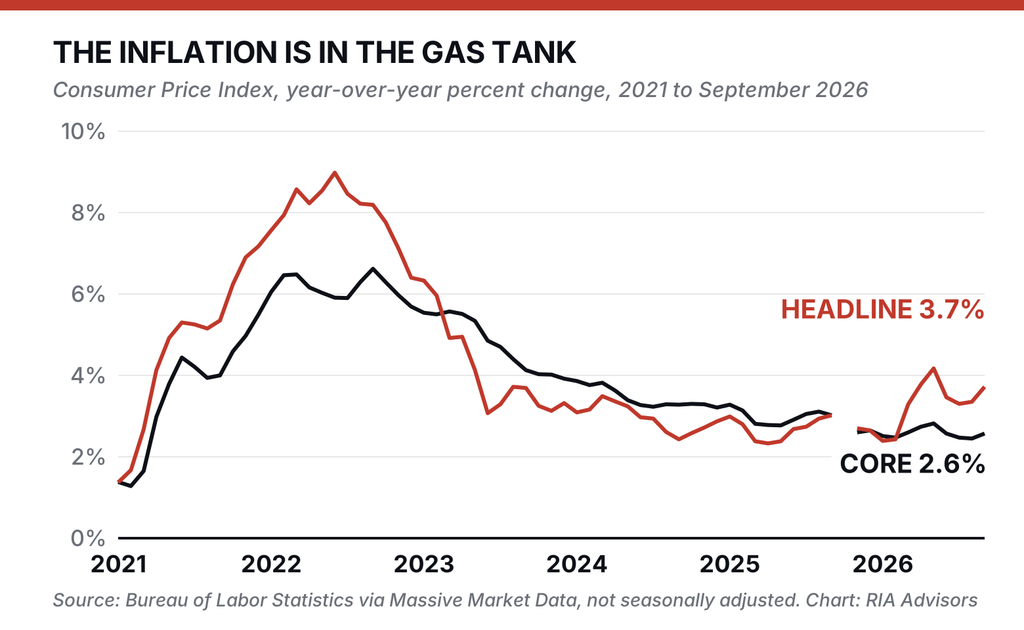
Notice in the chart above that the red and black lines diverge in March 2026. That is the oil shock, and it hasn’t spread into the core. Wages tell the same story. Average hourly earnings rose 3.0% over the past year, per the September jobs report, which is hardly a “wage-price spiral.” Employers added just 29,000 jobs in September, and July was revised to a loss of 10,000.
Is this the kind of inflation that sends yields to 6% and keeps them there? No. This is “bad inflation,” the supply-shock variety that eats into household budgets until spending slows, hiring stalls, and the very price pressure that started the scare begins to fade on its own. It doesn’t justify “higher for longer” forever. Gasoline now runs $4.33 a gallon nationally, up from $2.98 before the current oil shock (AAA data cited by CBS News). That extra $1.35 per gallon isn’t spent elsewhere, and the economy slows under its weight. Energy-driven inflation without wage growth behind it is a tax on consumers, and taxes slow economies. Slowing economies don’t sustain 6% bond yields.
Every Yield Peak Since 1990 Ended The Same Way
Bob Farrell’s Rule #1 is that markets tend to return to the mean over time. Bond yields are no exception, and when I went back through the Federal Reserve’s daily Treasury data and pulled every major 10-year yield peak since 1990, 6 of them stand out, and each one looked unstoppable at the time.
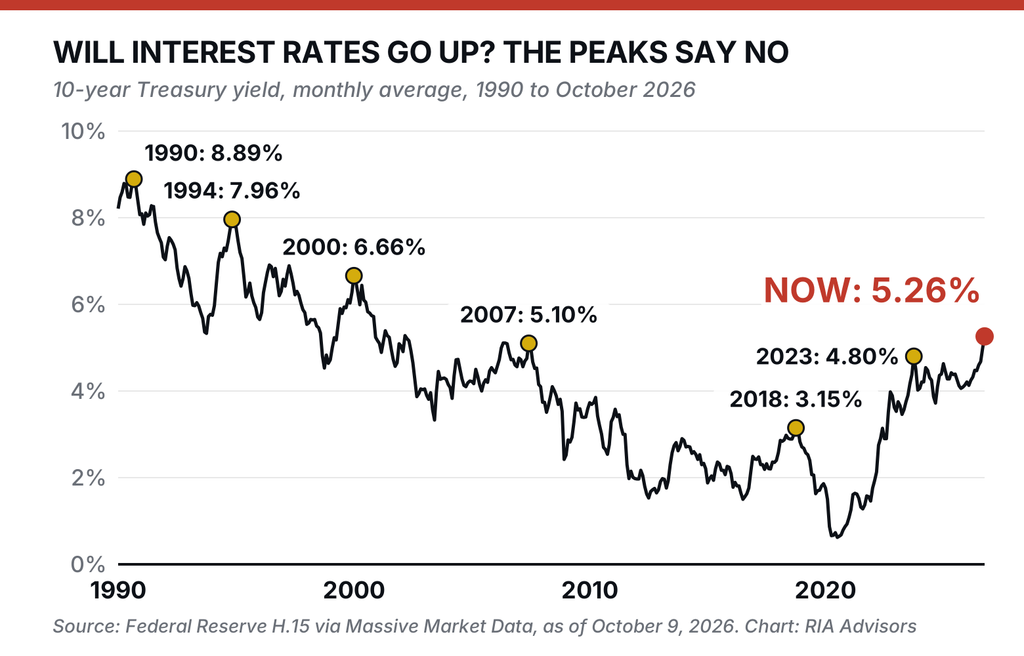
Here are the details of that research. The table below uses the daily closing high for each episode, then measures where the yield sat 12 and 24 months later. It also lists what was happening as yields fell, because yields rarely fall for “positive” reasons.
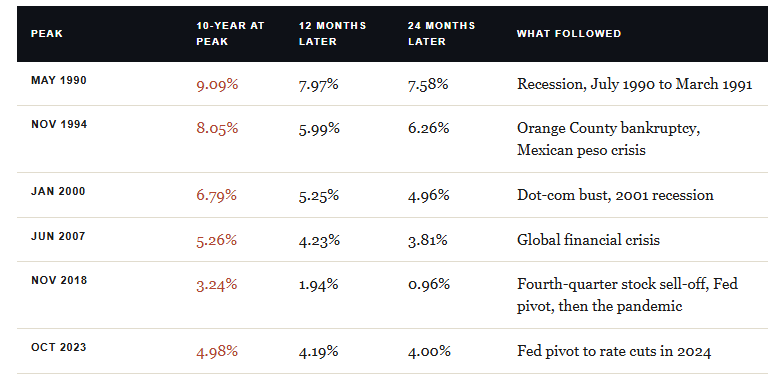
Step back for a moment and think about the data. Since 1990, there have been 6 interest rate peaks, and 6 periods of lower yields two years later. The mechanism was the same each time: higher rates tightened financial conditions until something gave, whether that was the economy, a levered corner of the market, or the Fed’s resolve. The average decline was 1.64 percentage points, within a range of roughly 1 to 2.25 percentage points.
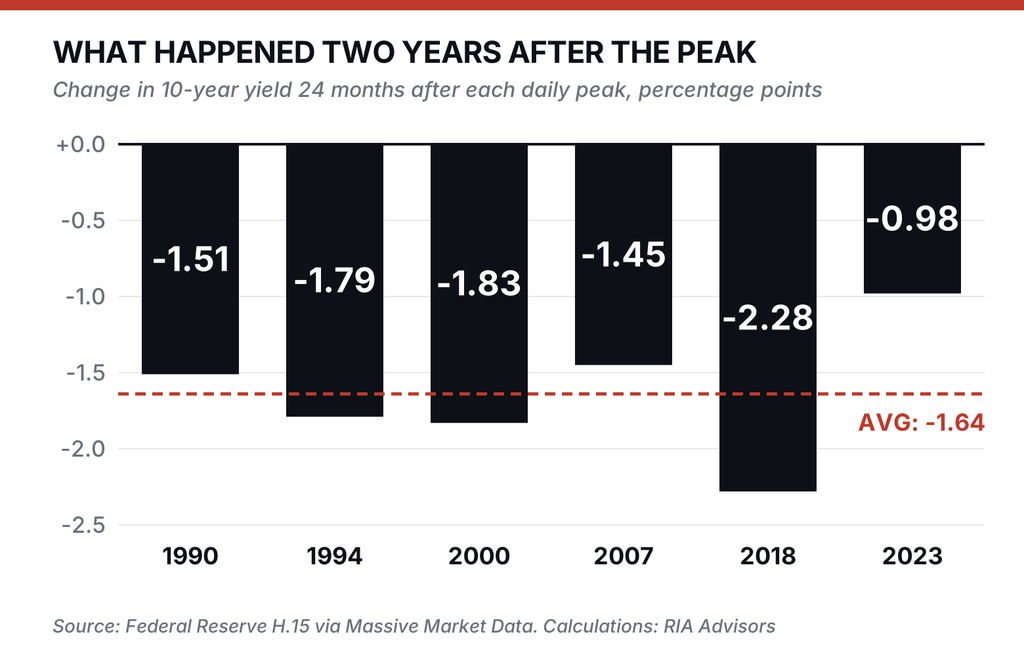
There are two caveats to mention. The first is that a peak is only a peak in hindsight. This study tells you how these episodes resolved, not the day they ended. Secondly, the 2018 figure includes the pandemic collapse in rates, which flatters it. Still, even 12 months out, every case was lower, by more than three-quarters of a point at minimum. So, will interest rates go up from here? They can, for a while. The history says that the higher yields climb, the faster they break the thing that is pushing them higher.
“Yields don’t peak because investors get comfortable. They peak because something breaks, and at 5.3% the list of candidates is getting long.”
Real Rates Are Already Doing The Fed’s Work
This is where the data gets even more interesting. When we measure against core inflation, the 10-year Treasury now pays a “real yield” of roughly 2.7%. That’s the highest since 2010, and well above the 1.6% average since 1990. Real yields are what borrowers actually feel, regardless of what the “soft landing” crowd says. A business deciding whether to build a plant is weighing that number, just as much as a family deciding whether to buy a house. This is why if you are wondering whether interest rates go up from here, you should watch “real yields” closely.
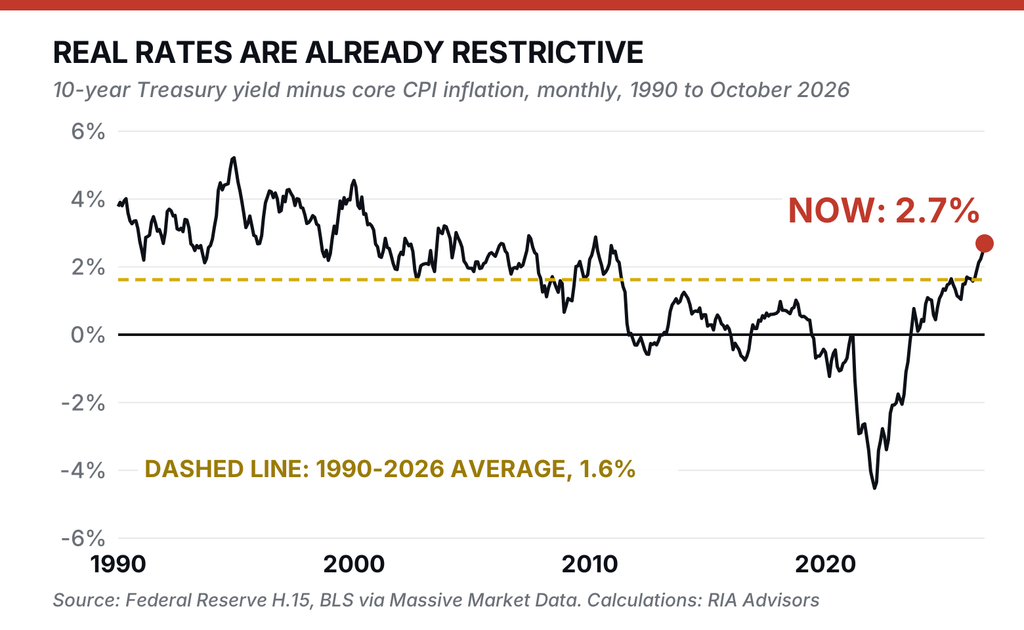
I’ve written about where I thought fair value sat for some time. To wit:
“By the mean-reversion logic the framework implies, the fair value of the 10-year is closer to 5.3% than to 4.6%.” – Rising Interest Rates: Why The Narrative Fails Against The Data, May 22, 2026
Interest rates have already returned to normal, and a move to 6% would be an overshoot of roughly 70 basis points beyond fair value. That level would also arrive just as payroll growth has nearly stalled and unemployment has climbed to 4.2%.
“But Lance, the debt is far bigger now than in any of those past episodes.“
I agree, and it certainly is. That is exactly why the overshoot is harder to sustain, not easier, because every extra point on the 10-year eventually rolls into the interest bill on the trillions of dollars of debt that Washington refinances every year. The CBO’s preliminary numbers show net interest on the public debt hit $1.143 trillion in fiscal 2026. That’s up 11% in a year and accounts for about 21% of all federal receipts.
Higher rates on a bigger debt pile drag on growth. That drag eventually shows up as lower yields, not higher ones. I made that case in detail in “Normal Interest Rates: What The Debt Panic Gets Wrong.”
Will Interest Rates Go Up Further? What It Means For Investors
Go back to the line I asked you to remember. Ivascyn’s own scenario says a move to 5.5% or higher brings “some decent weakness in risk markets, both credit and equity.” That is precisely the environment in which high-quality bonds tend to do their job. If rates spike far enough to hurt stocks and credit, the spike itself often sets up the bond rally. In other words, the 6% scenario partly contains its own cure.
That doesn’t mean loading up on long-duration bonds and walking away. In this past weekend’s Bull Bear Report, we noted that we’ve slightly shortened clients’ bond duration. Overall bond allocations remain in place. The trade-off is plain: duration protects you in a growth shock, when yields fall and bond prices rise, but it hurts you in an inflation shock, when yields keep climbing and longer bonds take the most pain.
If you are drawing income from your portfolio, a 5% yield is also a real cushion. It helps against the sequence of return risk I covered last week.
For the full case on owning Treasuries at these levels, see “Bonds At 5%: Is The 10-Year Treasury Finally A Buy?“
Waiting for 6% before doing anything is a bet in itself. Every peak in the table above looked like it had more room to run at the time. Whether interest rates go up another half point or roll over next month, a few basics hold. Know your portfolio’s duration and whether it matches your time horizon. Staggering maturities means you’re never forced to bet everything on one rate call. And if an oil-driven second wave would damage your plan, some inflation protection earns its keep. Such is the difference between managing risk and forecasting it.
Bottom line:The 10-year could touch 6% on forced selling, but with core inflation cooling and growth stalling, 6% looks far more like the top of this cycle than a new floor.
Every one of the last six yield peaks felt like the start of something new. Each one turned out to be the end of something old. The only question is what breaks first this time.
📊 Market Statistics & Analysis
Weekly technical overview across key sectors, risk indicators, and market internals
💸 Market & Sector X-Ray: Market Gains Ground
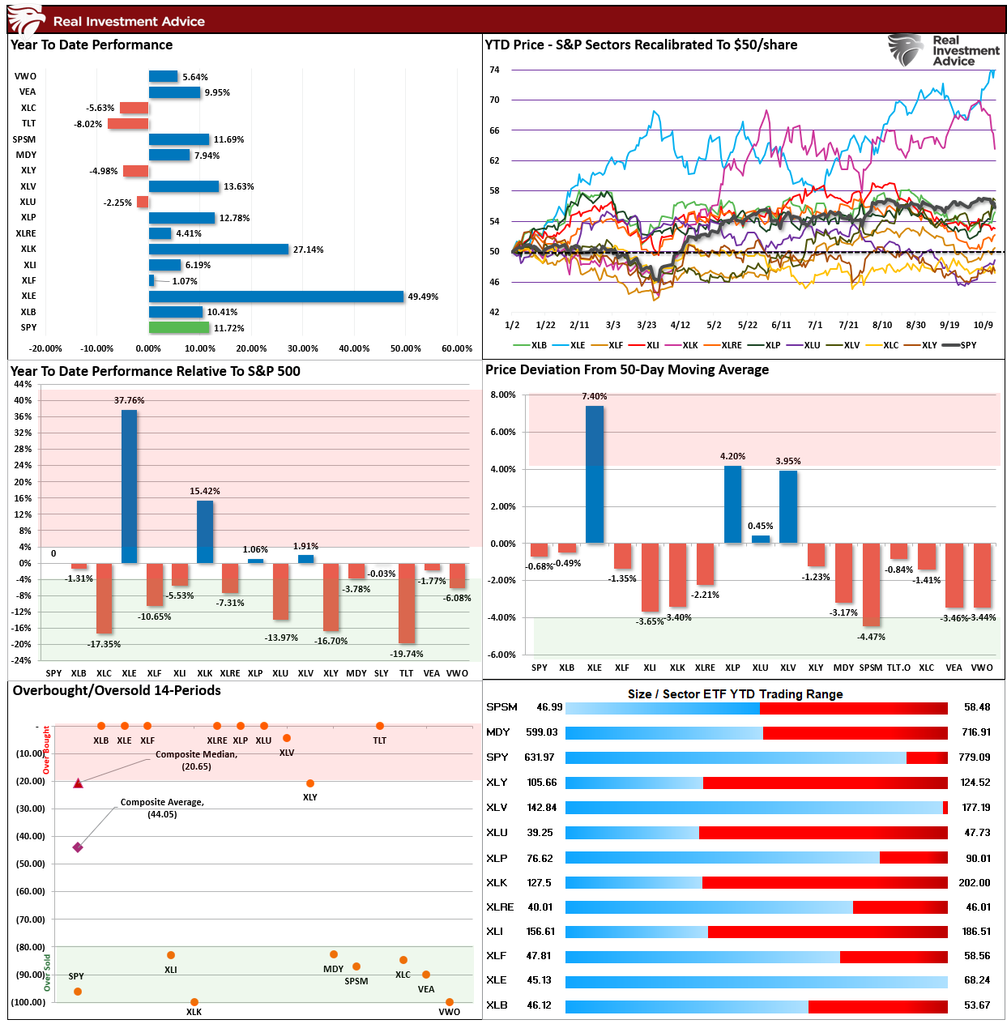
This next week, Q3 earnings season swings into full gear. The rotation this past week pushed the previously very oversold sectors (like bonds, staples, real estate, and utilities) back toward more overbought levels, while technology, mid-cap, and small-cap stocks sold off. Energy remains the outlier, and the one sector with the largest sell off potential, given its deviation from long-term means, but is dependent on the direction of oil.
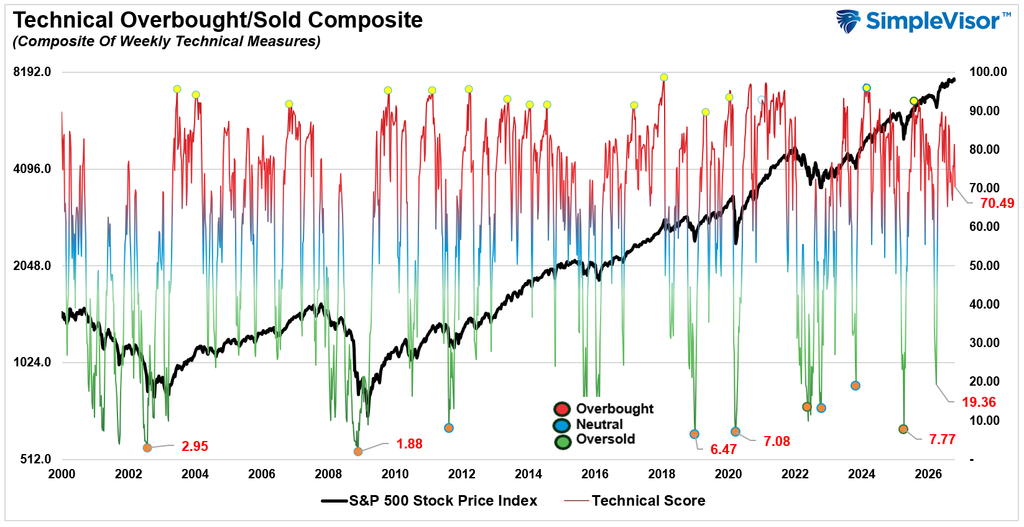
📐 Technical Composite: 70.49 – Sell Off Reduces Overbought Conditions
The technical condition eased somewhat last week as the technology sector came under decent pressure. However, the technical conditions didn’t deteriorate as much as one would have expected, given last week’s rotation from growth to value and improving breadth. With the technical conditions more “neutral,” the market’s direction next week isn’t clear, but it will certainly be driven by the deluge of corporate earnings starting on Monday.
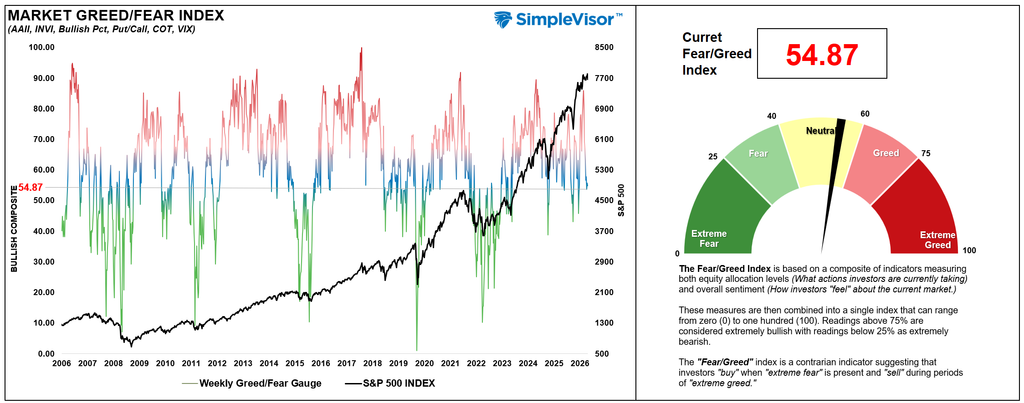
🤑 Fear/Greed Index: 54.87 – Holding At Neutral
Even though the market sold off last week, the underlying market allocation and sentiment remain more neutral. There was a continued drop in the Commitment of Traders equity allocations; however, investor sentiment turned slightly more bearish last week. If the market can continue to hold up into earnings season, it could present a good buying opportunity over the next month or so.
🔁 Relative Factor Performance
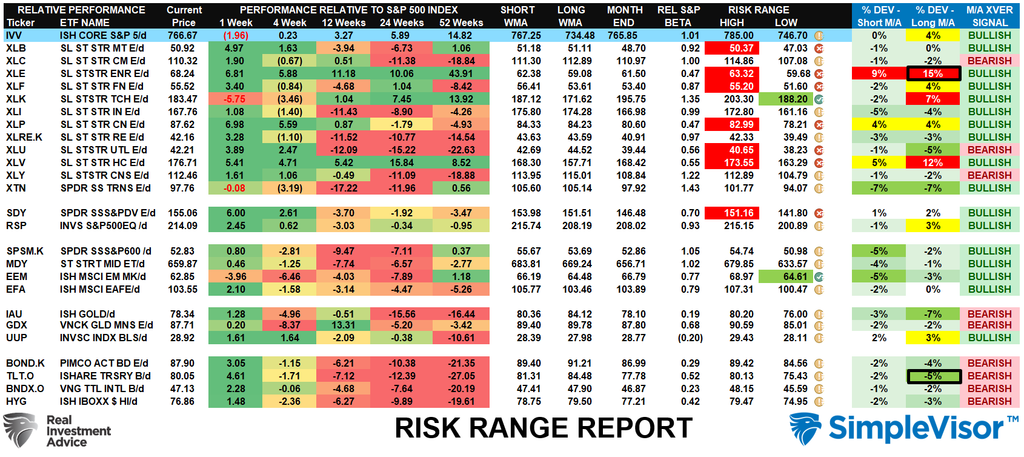
Two weeks ago, we stated that “Factor performance has diverged over the last couple of weeks, with Growth, Speculative Technology, and Megacaps now extremely overbought, while Value, Low Beta, and Dividend Yield (interest rate-sensitive sectors) are now the most oversold.” This past week, we saw that reversal come on strong, with Technology selling off and healthcare and staples rallying. While the reversal may have some more room to go next week, there is likely a coming opportunity to start buying some technology companies here soon.
📊 MFBR Index (Money Flow/Breadth Ratio Indicator)
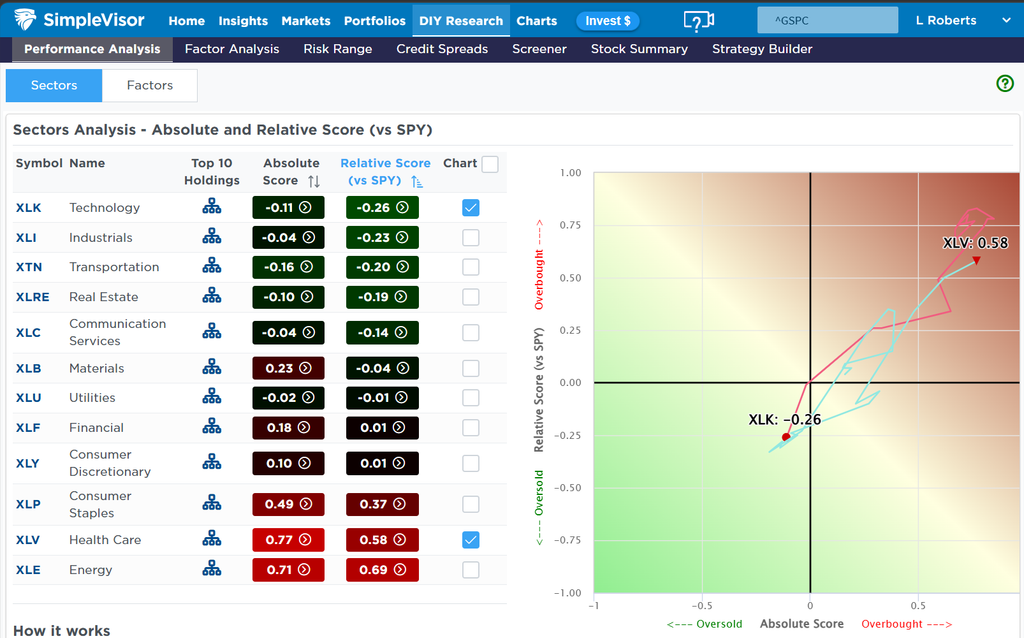
The Money Flow Breadth Ratio (MFBR) model is a rules-based equity allocation framework that uses weekly S&P 500 money flow data to generate buy, sell, and neutral signals. The MFBR systematically adjusts portfolio equity exposure in response to the direction and persistence of institutional capital flows. It aims to reduce drawdowns while capturing the majority of market upside.
“As of October 16, 2026, with the S&P 500 at 7,659.44, the Money Flow Breadth Ratio (MFBR) stands at 55%, down from a peak of 75% set 7 weeks ago and falling versus 60% the prior week. The trailing four-week change is still -10 percentage points, but the near-term trend has rolled over. This places the indicator in the 50-60% range. The raw zone signal reads NEUTRAL, but the model still flags a TOP REVERSAL, with 20 points now off the peak. Read that NEUTRAL as a zone label, not as fresh confirmation – the model reached this band by falling out of overbought, not by building up from below.
Bottom line: hold the target weight. The roll-over off the 75% peak is real and worth watching, but it has carried the gauge into the band that has historically been the best place to own equities. This is neither a chase nor a de-risk. A sustained break below 60% would move the grid to an underweight; a move back above 70% would re-engage the contrarian trim.”
📊 Sector Model & Risk Ranges
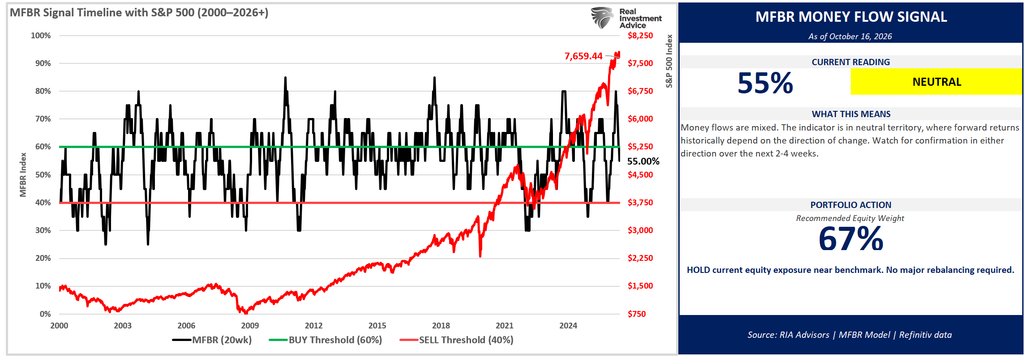
We noted last week that “Energy and Technology are now extremely deviated above their long-term weekly means. Historically, such deviations lead to corrections or consolidations, so profit-taking and rebalancing are recommended.” That advice worked well this past week as the rotation from Technology to Value picked up steam. Bonds also rallied but remain very oversold. While some of the overbought conditions have reversed, there could still be some additional pressure next week, so trade accordingly.

Comments
Log in or sign up to join the conversation.