

The PPI vs CPI gap is the widest since 2022, and history says record profit margins are in the crosshairs.
Key Takeaways
Producer prices rose 6.3% in the year to September 2026, the fastest pace since late 2022. Consumer prices rose 3.7%. That 2.6-point PPI vs CPI gap reflects costs companies are eating rather than passing on.
Further up the pipeline, the pressure is larger still: processed goods for intermediate demand rose 14.1%, and unprocessed goods rose 21.5%.
After-tax corporate profits hit a record 13.1% of GDP in the second quarter. Third-quarter earnings are tracking 30% growth, and analysts expect 28% next quarter.
Six times since 1950, producer inflation outpaced consumer inflation by 4 points or more. In four of them, the profit share of GDP fell 1 to 4.4 points within two years. The two exceptions had consumers with rising incomes. Today, real hourly earnings are down 0.7%.
The most important number in October’s inflation reports wasn’t the one that made the headlines. Everyone watched the Consumer Price Index print 3.7%. Far fewer noticed the Producer Price Index for final demand. It jumped 1.3% in a single month, the largest gain since March 2022, and the annual rate hit 6.3%.1 When you put PPI vs CPI side by side, the gap tells you who is paying for inflation. Right now, that’s corporate America, and it’s paying from the highest profit margins ever recorded.
PPI vs CPI: What The Gap Actually Measures
Most investors treat the two reports as interchangeable “inflation” readings. They aren’t. The CPI measures what households pay at the register. The PPI measures what businesses receive for their output, and its intermediate stages measure what they pay for inputs. In other words, the PPI is the cost side of the income statement. For any company selling to consumers, the CPI is the revenue side.
That distinction matters because margins live in the space between them. When producer prices rise faster than consumer prices, someone in the chain is absorbing the difference. Sometimes it’s a wholesaler. Often it’s the company at the end of the line, the one selling to a household that just watched its gasoline bill jump and its real paycheck shrink, that can’t push the higher price through without losing the sale. A widening PPI vs CPI gap is a margin signal first and an inflation signal second.
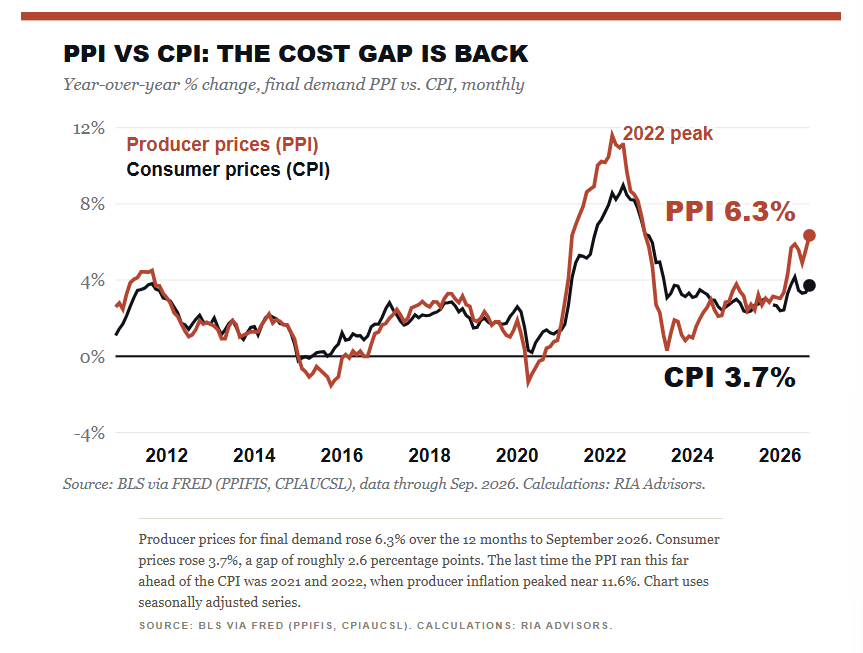
Notice in the chart above that the two lines tracked each other closely for most of the last decade. The exceptions are the episodes worth studying. In 2015 and 2016, producer prices fell faster than consumer prices as oil collapsed, which handed companies a margin tailwind. The 2021 and 2022 surge did the opposite. Today’s gap is smaller than 2022’s. But it’s opening from a far higher starting point for profitability, and that changes the math.
The Price Pipeline Is Loaded
The final demand number understates the problem. The PPI is built in stages, and the earlier stages show what is still working its way toward finished goods. To wit:
“In September, prices for processed goods for intermediate demand rose 14.1 percent… the index for unprocessed goods for intermediate demand rose 21.5 percent.”– U.S. Bureau of Labor Statistics, Producer Price Index release, October 15, 2026
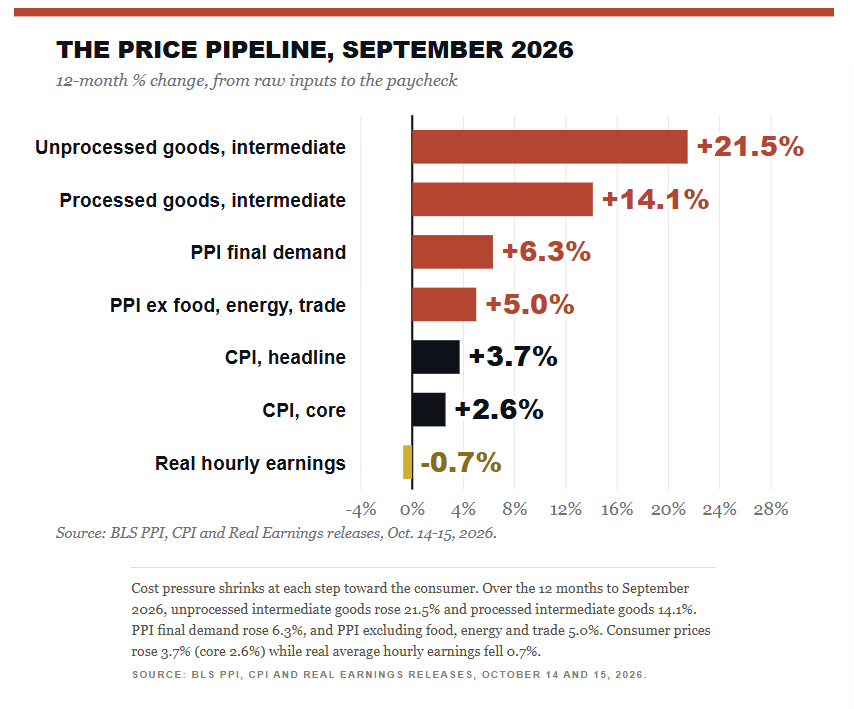
Read that chart from top to bottom and the story writes itself. Raw inputs are up more than 20%. By the time those costs travel through refiners, manufacturers, freight carriers and retailers and finally reach the checkout counter, consumer prices are up less than 4%, which means a great deal of cost is being swallowed somewhere between the top bar and the bottom bars. Energy did most of the damage in September. Final demand energy prices jumped 10.8% in one month, and gasoline station sales rose 6.4%.1,3
Such is the nature of an energy shock, and why calling it “transitory” misses the point. It hits every producer at once, through fuel, freight, chemicals and packaging, long before it shows up on a store shelf. I’ve written about this dynamic before in our analysis of why the May inflation headline was an oil story. The difference now is that costs are moving down the pipeline faster than consumer demand can absorb them.
Why Wall Street Isn’t Worried About Profit Margins
Here’s where it gets interesting. Despite cost pressures, analysts are about as optimistic about earnings as they’ve ever been. With 60% of S&P 500 companies reporting, FactSet shows blended third-quarter earnings growth of 30.2%. Analysts expect 28.4% for the fourth quarter and 32.9% for calendar 2026. Watch this, though: the aggregate earnings surprise is just 1.9%, the smallest since late 2022.5
FactSet now puts the second-quarter net profit margin at a record 17.0%, and the blended third-quarter margin at 14.9%, the second-highest since it began tracking in 2009. Analysts expect margins to climb back to 15.2% in the fourth quarter and higher still into 2027.6
13.1%
After-tax corporate profits as a share of GDP in Q2 2026, the highest on record and nearly double the 7.4% average since 1947.
The macro data confirms just how stretched profitability already is. After-tax corporate profits reached 13.1% of GDP in the second quarter. That’s a record going back to 1947, and well above the 7.4% long-run average.4
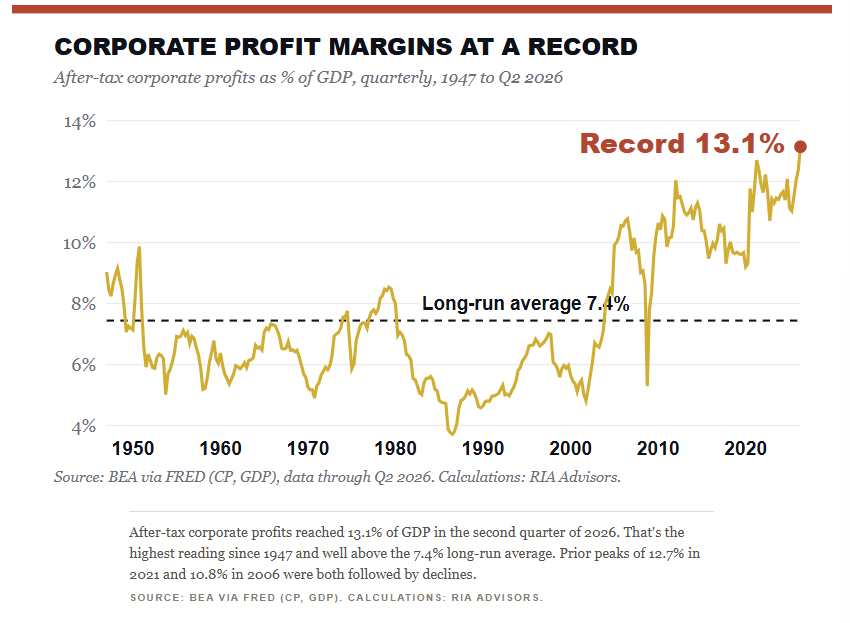
From a contrarian view, Wall Street is wildly optimistic about the future. Historically, when the consensus is for pricing margins to hold at record levels while input costs run at double-digit rates, something tends to happen. While it’s not impossible that the optimism is correct, it just requires companies to pass those costs on to consumers whose paychecks are shrinking in real terms, and that is a much bigger assumption than the “30% earnings growth” headline implies.
What Does The PPI vs CPI Gap Tell Us About Profit Margins?
The September gap isn’t a one-off, so I went back to the long-run data. The PPI for all commodities runs back to 1947. Using it, I measured how far producer inflation outran consumer inflation each quarter. Then I tracked what happened to the corporate profit share of GDP.7,9
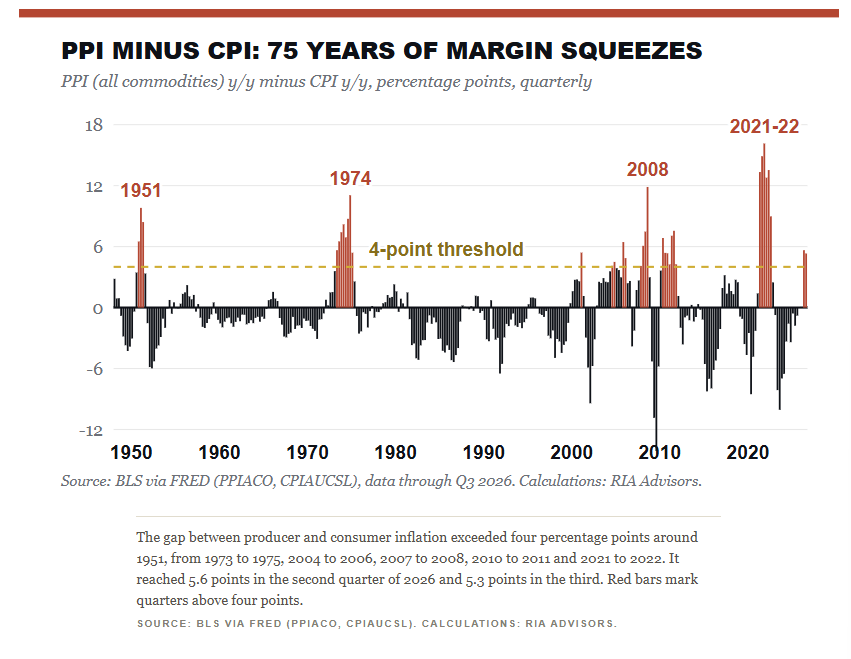
The results aren’t a perfect signal, and I don’t want to oversell them. The correlation between the gap and the next year’s change in profit share is negative but modest. However, the large episodes tell a clearer story, shown in the table below.
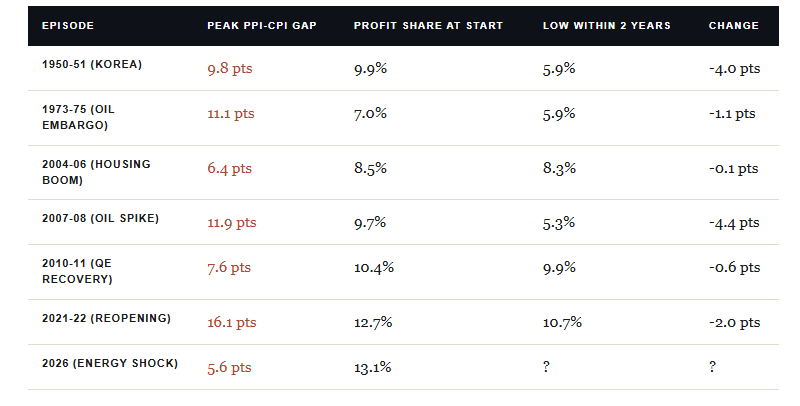
Four of the six prior episodes saw the profit share fall by a point or more within two years. The two that escaped, 2004 to 2006 and 2010 to 2011, share a common thread. Consumers had money to spend. In the mid-2000s, it came from mortgage equity withdrawal, and after 2009 it came from recovering employment and the Fed’s balance sheet. Both times, companies could pass costs through because demand was funded, whether by a home equity ATM or by a central bank buying bonds, and customers kept paying the higher prices without much complaint. The PPI vs CPI gap doesn’t kill margins on its own. It kills margins when the consumer can’t pay the higher price.
Where The Bulls Are Right
The other side of this debate has real merit, and I’ll lay it out plainly. Retail sales rose 0.8% in September and are up 6.3% from a year ago.3 Companies are beating earnings estimates at an 82% clip.5 And the AI capex boom is generating real demand for chips, power and construction. That supports pricing power in exactly the sectors driving index earnings.
“But Lance, companies passed costs through just fine in 2021. Why would this time be different?”
Because the consumer of 2021 was sitting on stimulus checks, enhanced unemployment benefits and a pile of excess savings built up during lockdowns, while the consumer of 2026 has none of that cushion to draw on. Real average hourly earnings fell 0.7% over the past year.2 I covered what that means for consumer-facing companies in Real Wages 2026: Why Consumer Stocks Feel It First.
Strip gasoline out of September’s retail sales and spending rose just 0.2%. Higher fuel prices did most of the lifting.3 Such is the difference between “good” and “bad” inflation, which I laid out in detail in Bad Inflation Cures Itself. Good Inflation Doesn’t. Good inflation comes with rising incomes that fund higher prices. Bad inflation arrives via a supply shock with no paycheck to back it, so it eventually destroys the demand it depends on. That’s the setup the pipeline chart describes. It’s why I’m reasonably confident the margin consensus is too high for 2027, even if the next quarter or two looks fine.
“Costs are running at double-digit rates up the pipeline and consumer paychecks are shrinking in real terms. Someone has to eat the difference, and the earnings estimates assume it won’t be shareholders.”
A question that keeps landing in my inbox puts the bull case another way: if margins are at a record, doesn’t that prove companies have “pricing power”? It proves they HAD it. Margins are a lagging measure.FactSet’s S&P 500 margin has already slipped from a record 17.0% in the second quarter to 14.9% in the third, although one-time valuation gains at Alphabet and Amazon inflated that Q2 record. Second-quarter profits were booked before September’s 10.8% jump in energy producer prices. Third-quarter profit data won’t arrive for weeks.
What PPI vs CPI Means For Your Portfolio
None of this argues for a dramatic move. It argues for paying attention to the part of the earnings story the market is taking for granted. With the 10-year Treasury yield near 4.9%, investors also have a real alternative to paying full price for peak margins. I made that case recently in Bonds At 5%: Is The 10-Year Treasury Finally A Buy? 8
Here’s what I’d be watching through the rest of earnings season and into the Fed’s December 9th meeting. The Fed held rates steady on October 28, but two officials, Lisa Cook and Beth Hammack, dissented in favor of a hike. Margin guidance matters more than earnings beats. A “beat” against lowered estimates is easy. Instead, listen for companies citing input costs, freight, and energy when they guide the fourth quarter.
Estimate revisions come next. If that 28.4% fourth-quarter growth estimate keeps slipping (it was 28.6% two weeks ago) in the weeks after companies report, the market is beginning to price the squeeze, and that tends to happen well before the profit data itself confirms anything.
Then look at where your own holdings sit in the pipeline. Businesses that buy commodities and sell to stretched consumers are on the wrong side of this gap. Those with contractual pricing or inelastic demand sit on the better side. Finally, consider what you’re paying. At 19x forward earnings, the market is valuing record margins as if they were permanent.5
As we noted in Corporate Profits: A Reading Without Rose-Tinted Glasses, profits have a long history of reverting toward the economy’s ability to fund them. The trade-off is that leaning defensive too early has a cost if margins hold for another year. However, rebalancing to your target allocation after a strong run is a simple form of risk management. It costs very little if I’m wrong.
Bottom Line
The PPI vs CPI gap says companies are absorbing costs their customers can't afford, and record margins leave very little room to absorb much more.
Costs can climb for a long time before margins crack. The crack comes when the customer stops paying, and the paycheck data says that customer is already tapped out.
Questions This Article Answers
What is the difference between PPI and CPI?
The Consumer Price Index measures prices households pay for goods and services. The Producer Price Index measures prices businesses receive for their output, with intermediate stages that track input costs. When the PPI rises faster than the CPI, companies are absorbing costs they haven’t passed on to consumers.
Does PPI lead CPI?
Often, though not mechanically. Input costs show up first in the PPI’s intermediate stages and can take months to reach consumer prices. If consumers can’t afford higher prices, much of that cost never reaches the CPI and instead hits profit margins.
What does the PPI report mean for stocks?
A PPI that runs well ahead of the CPI is a warning for corporate profit margins. In four of six prior episodes since 1950 where the gap exceeded four points, after-tax profits as a share of GDP fell one to four points within two years.
Are corporate profit margins at a record high?
Yes. After-tax corporate profits reached 13.1% of GDP in the second quarter of 2026, the highest since records began in 1947, versus a long-run average of 7.4%. FactSet also reported a record S&P 500 net margin of 17.0% for the same quarter.
Sources & Notes
U.S. Bureau of Labor Statistics, Producer Price Index News Release, September 2026, released October 15, 2026. Final demand +1.3% m/m (SA), +6.3% y/y (NSA). Energy +10.8% m/m. Processed intermediate goods +14.1% y/y, unprocessed +21.5% y/y.
U.S. Bureau of Labor Statistics, Real Earnings, September 2026, released October 14, 2026. CPI-U +3.7% y/y, core +2.6% y/y. Real average hourly earnings -0.7% y/y.
U.S. Census Bureau, Advance Monthly Sales for Retail and Food Services, September 2026, released October 15, 2026. Total +0.8% m/m and +6.3% y/y. Ex gasoline stations +0.2% m/m. Gasoline stations +6.4% m/m.
Bureau of Economic Analysis, corporate profits after tax without IVA and CCAdj (CP) and nominal GDP, via FRED, accessed October 19, 2026. Profit share is CP divided by GDP, 1947 Q1 to 2026 Q2.
FactSet, S&P 500 Earnings Season Update, October 30, 2026. Blended Q3 earnings growth 30.2%, Q4 estimate 28.4%, CY2026 32.9%, forward P/E 18.7, EPS beat rate 82%, aggregate EPS surprise 1.9%.
FactSet, S&P 500 Reporting Second-Highest Net Profit Margin In More Than 15 Years For Q3 2026, October 26, 2026. Q2 record 17.0%, Q3 blended 14.9%, Q4 estimate 15.2%.
BLS Producer Price Index for all commodities (PPIACO) and final demand (PPIFIS), and CPI-U (CPIAUCSL), via FRED, accessed October 19, 2026.
Federal Reserve H.15 Treasury yields via Massive Market Data. The 10-year constant maturity yield was 4.91% on November 2, 2026.
Federal Reserve, FOMC Statement, October 28, 2026. Target range held at 3.75% to 4.00% in a 10-2 vote, with Lisa Cook and Beth Hammack preferring a 25-basis-point hike.
Replication note. Headline figures (6.3% PPI, 3.7% CPI) are BLS published rates. Charts use seasonally adjusted index levels, and RIA’s recalculation gives 6.35% and 3.72%, matching the published figures. The long-run gap uses PPIACO (not seasonally adjusted) against seasonally adjusted CPI, sampled at the first month of each quarter, because the final demand PPI only begins in 2009. The October 2025 CPI was not published, so that quarter is omitted. Episodes are defined as runs of quarters separated by more than four points. The relationship between the gap and the following year’s change in profit share is negative but modest (a correlation of about -0.22 from 1948 to 2025), so the article leans on the episode record rather than the average.


Comments
Log in or sign up to join the conversation.