


🏛️ Market Brief – A Bond Scare
The week belonged to the bond market. Long-dated Treasury yields spiked to levels not seen in decades, with the 30-year touching a 19-year high above 5.30% mid-week and the 10-year closing Friday at 4.738%, near a 20-month high. Those seem to be really scary numbers, but as discussed on Friday, this is just a return to normalcy after 15 years of abnormally low rates.
Nonetheless, the move forced the Treasury’s hand. On Wednesday, Secretary Bessent doubled the size of the government’s long-bond buybacks to calm the selling. As I flagged a few weeks ago in Are US Treasuries Still A Safe Asset?, the risk in this cycle has migrated out of stocks and into the plumbing of the bond market. This week made that migration impossible to ignore. (We will discuss another risk momentarily).
The reaction told the story. Money did not flee to cash; it fled to hard assets, and the scoreboard was lopsided: bitcoin (BTC.X) ripped roughly 23% higher in its best week since 2023 to close in on $79,000, gold (GLD) added 5.5%, finally reclaiming $4,500, and oil gained more than 6% as the Iran stalemate kept a supply premium in the price.
Equities were the mirror image. The S&P 500 (SPY) slipped 1.33% on the week to 7,674, the Nasdaq 100 (QQQ) dropped 2.41%, and the Russell 2000 (IWM) lost 1.63%, while the Dow (DIA) held up better at down 0.80%. Here is the tell that matters. The equal-weight S&P (RSP) fell just 0.45%, far less than the cap-weighted index, leaving the damage concentrated in the previous momentum names rather than the average stock. A rising discount rate hits the longest-duration assets first, and right now, that is big tech.
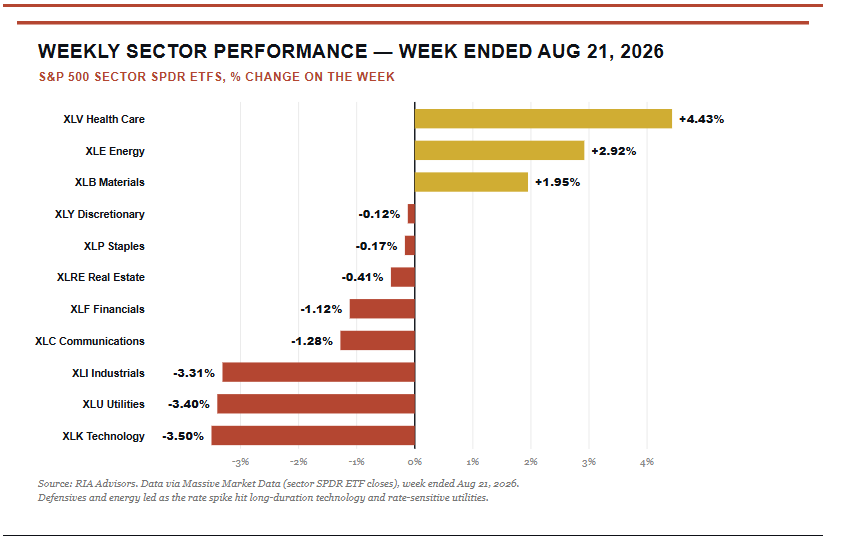
Sector leadership confirmed the rotation. Health care led, up 4.4%, with energy up 2.9% on the oil bid and materials up 1.9%. The laggards were exactly what a rate spike punishes: technology fell 3.5%, rate-sensitive utilities dropped 3.4%, and industrials lost 3.3%.
The thread to follow into next week is to watch the long end of the Treasury curve. As long as the 30-year keeps pressing against multi-decade highs, the pressure on mega-cap equity multiples and the bid under gold and bitcoin both stay in force. The bond market is running this tape now, and what happens next determines a lot.
📈Technical Backdrop – Momentum Rolls Over, What Next?
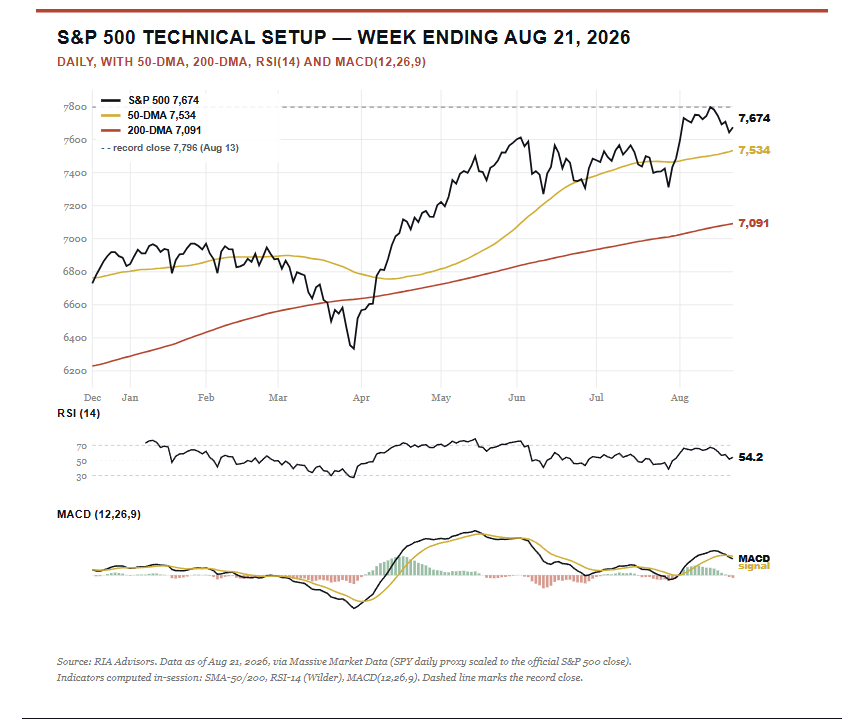
As noted above, while the overall market was only down mildly this past week, the momentum trade remained under pressure. Despite all the seemingly brutal headlines this past week, the S&P 500 is only down ~1.6% from the record close of 7,796 it set on August 13. However, it still sits about 1.9% above a rising 50-day moving average and a comfortable 8.3% above the 200-day, so nothing about the trend structure is technically broken.
Underneath, though, the momentum picture has quietly deteriorated. The MACD rolled over this week and crossed below its signal line, the first bearish crossover since the spring, with the histogram sliding to negative 9 index points. That is the kind of shift that tends to show up before price, not after it.
The 14-day RSI has cooled to 54, squarely neutral and well off the overbought readings that came with the August run to new highs. In plain terms, the buyers are getting tired even though the tape has not cracked. Volatility stayed notably calm through the decline, with the VIX easing on the week rather than spiking, which suggests the selling has been an orderly rotation rather than panic. This is worth noting because the market “calm” tends to last right up until it does not. September tends to be the weakest trading month of the year.
So, as we head into next week, here are the important levels to watch.
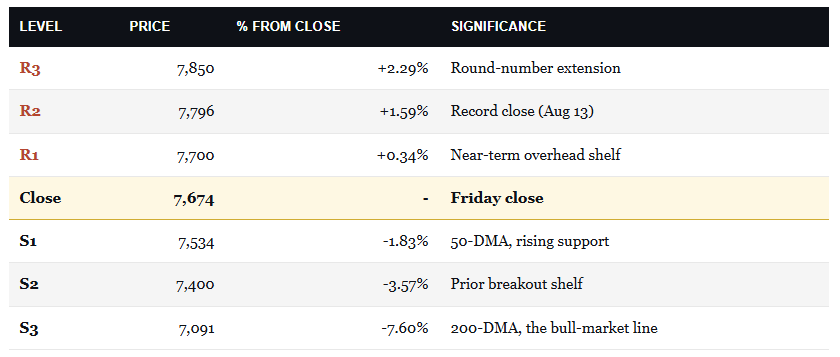
The first resistance level is the 7,700 shelf, then the 7,796 record. Goldman Sachs (GS) currently has 8,000 as its year-end target for the market, which doesn’t leave much headroom. On the downside, the 50-DMA near 7,534 is the line that counts. It has held every pullback since April, and a decisive close beneath it would be the first genuine technical warning that the character of this market has changed. Below there, 7,400 is the next shelf, and the 200-DMA at 7,091 is the level that defines the bull market itself. That is a 3-to-1 risk/reward outlook, which should be considered relative to your equity exposure levels.
For positioning, this is a moment for discipline, not heroics. With momentum rolling over into a wall of event risk, we continue to recommend trimming the most extended mega-cap technology winners back toward model weight and letting cash build rather than chasing the tape up here. The place to add is the 50-DMA, not the highs, and a close below 7,534 is the trigger to get more defensive.
The single line to watch is the 50-day at 7,534. Hold it, and this is a routine pullback inside an uptrend. Lose it on a closing basis, especially on a hot inflation print or a soft Nvidia (NVDA) guide, and the momentum divergence flashing right now becomes a great deal more than a footnote.
🔑 Key Catalysts Next Week
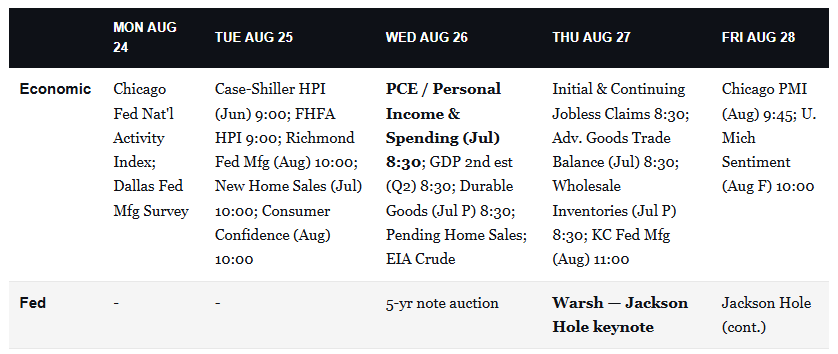
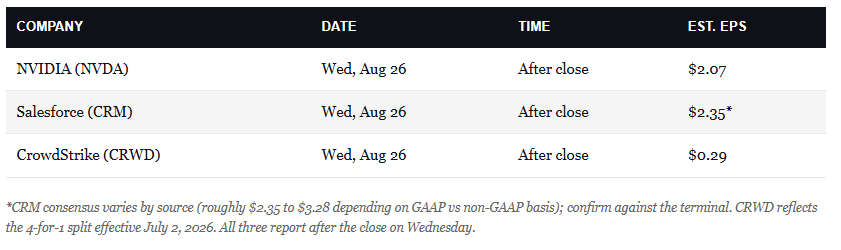
After a week driven by the bond market, next week hands the tape three separate stress tests, all stacked on top of one another. Wednesday morning, we get the July PCE report, the Fed’s preferred inflation gauge, alongside the second estimate of Q2 GDP and July durable goods orders. Then, after the close that same day, Nvidia reports earnings.
Next Wednesday will tell us whether inflation is reaccelerating and whether the AI capital-spending engine is still running. Full stop.
The inflation print carries the most macro weight. After this week’s yield spike, a hot PCE number would pour fuel on the fire and validate the bond market’s fear that the Fed is stuck, while a soft print would hand the bulls some relief and take pressure off the long end. Given how the 30-year behaved this week, the risk is asymmetric to the upside on inflation.
Nvidia is the other side of the barbell. Wall Street consensus is looking for roughly $2.07 in earnings on about $92 billion in revenue, a 67% jump from a year ago. With the entire AI trade leaning on this single report, the guidance matters more than the print itself. A strong number could reignite the mega-cap leadership that just took a beating, while a cautious one landing on top of a hot PCE would be a real problem.
Then there is the Fed. On Thursday, new Chair Kevin Warsh delivers his first Jackson Hole keynote since taking over in May. Coming just days after the Treasury had to step into the bond market, whatever he says about the balance sheet, the Fed’s backstop, and the path for rates will be parsed to death. This is the highest-stakes Jackson Hole in years.
The marquee earnings all land on Wednesday after the close.
💰 The Basis Trade: Is The Bond Market Signal Distorted?
The 30-year Treasury just touched 5.34% this week. We have not seen a yield that high in 19 years, and the 10-year sits near 4.64%. The easy read is that the bond market is screaming about deficits, inflation, and a wall of new supply. I don’t disagree, as most of that read is right. As I noted recently in “Are US Treasuries Still A Safe Asset?“, a repricing is not a default. But the Federal Reserve just published research that complicates the story. The culprit is something you may not have heard of, with a dull name: the basis trade.
What The Basis Trade Actually Is
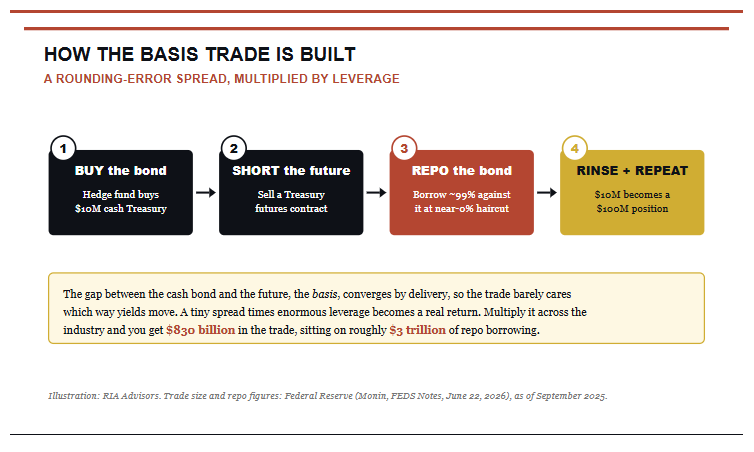
The “basis trade” is simple to describe, but very dangerous to scale. Here is how it works.
A hedge fund buys a cash Treasury and, at the same moment, sells a Treasury futures contract against it.
Those two prices converge by the delivery date. The fund pockets the gap between them, the “basis,” almost regardless of where yields go.
The basis trade on a single treasury bond is a rounding error.
The hedge fund then pledges the bond in the repo market. Borrows against it at a near-zero haircut, and puts the proceeds right back into the same trade.
Wash, rinse, and repeat.
While the spread is so thin it barely registers, repeatedly borrowing against the position makes that number large. Then, once every large fund runs the same trade, that number becomes large enough to move the entire bond market. In other words, when $10 million of capital can carry a $100 million position, that is 10x leverage at work.
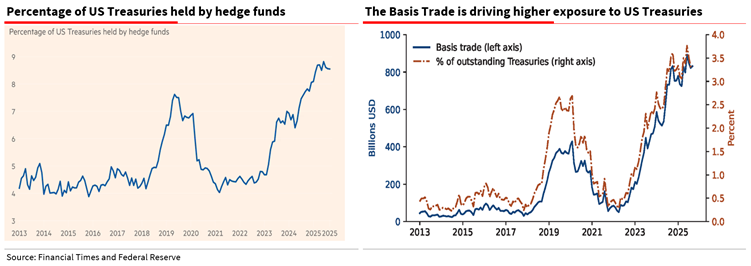
The Fed now pegs the basis trade at roughly $830 billion. That is about double its pre-2020 peak, and that financing sits inside a $3 trillion pile of repo borrowing. Such is the nature of any carry trade. It looks riskless right up until something breaks.
The New Owner Of The Bond Market
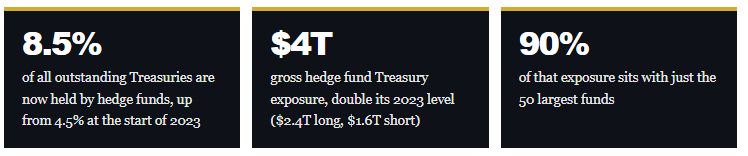
Step back, and the basis trade is one piece of a much larger shift. Hedge funds have doubled their total Treasury footprint since 2023. Their long book now accounts for 8.5% of the Treasury’s outstanding, up from 4.5% at the start of 2023, more than the entire US mutual fund industry holds and more than the whole banking system.
Read that again. Fifty funds, most of them financed overnight in a market that can seize up without much warning, now stand exactly where foreign central banks, pension funds, and insurers, the patient money that almost never had to sell, used to stand.
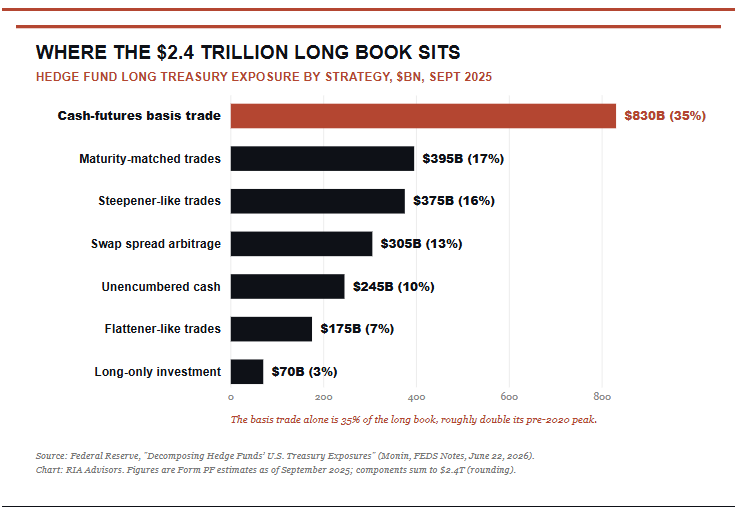
The chart below shows where that $2.4 trillion long book resides. The basis trade dominates at 35%, with swap spread arbitrage and curve trades filling most of the rest. Genuine buy-and-hold money is a rounding error at 3%. This is not the price-insensitive ownership the Treasury market was built on. As I wrote in February in “Is China Really Dumping US Treasuries?,” the foreign official bid has faded over the past decade, so something had to fill the hole. Leverage did.
How The Basis Trade Bends The Signal
Here is why any of this touches the number on your screen. A long Treasury yield is really two things added together:
The market’s expected path for short rates, which carries its read on inflation, growth, and the Fed, and
The “term premium” is the extra compensation investors want for locking up money for a decade.
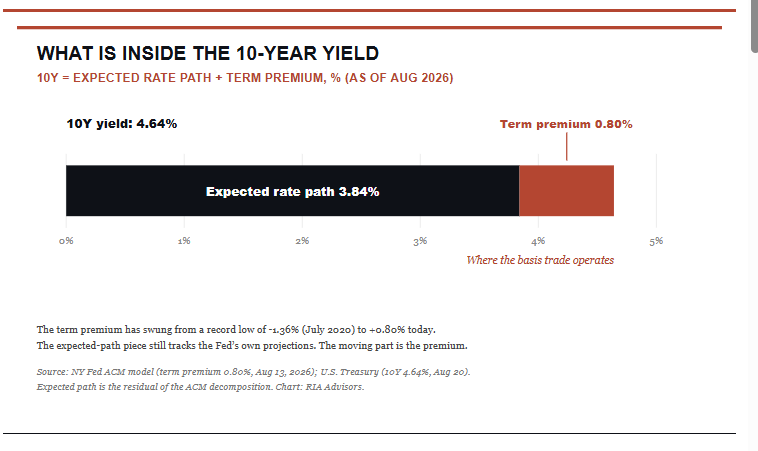
Split the 10-year into those pieces with the New York Fed’s model, and something jumps out. The expected-path component is tracking the Fed’s own projections closely. The part doing the moving is the term premium, and it’s exactly where the basis trade lives.
The issue at hand is that when hedge funds crowd in, they become net buyers of cash Treasuries. That short-term, manufactured demand pushes the term premium down. In other words, hedge funds may be suppressing the term premium, keeping yields lower than fundamentals alone would imply.
However, this is where the obvious question exists.
“If the trade pushes yields down, why are they going up?”
Because the basis trade is just one force among several, and right now, rising oil prices due to the Iran crisis and the AI borrowing boom are the stronger ones. That does not make the basis trade harmless, but it does make it a coiled spring under a market already strained.
The Fed made the link itself in its June minutes, noting that the shift toward “price-sensitive private investors” could affect the “term premium component of yields.” When your biggest marginal buyer is a leveraged fund that must sell the moment its financing tightens, the message inside the yield stops being a clean read on the economy. The signal is not clean.
What Happens When The Basis Trade Reverses
Here is the part that should keep you up at night. Every one of these trades assumes it can be closed calmly; however, that is always the case, and history says otherwise. The danger is not the trade, it is the exit. When a strategy is built to shrug off interest-rate direction, that trade can suddenly be forced to reverse, causing rates to move faster and further than any economic news would.
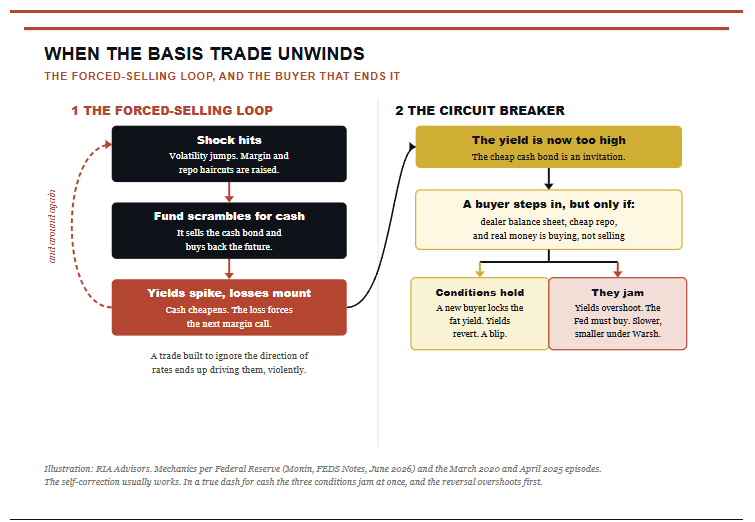
Just like all leveraged bets, when an event causes a reversal, it can trigger a chain reaction.
The unexpected, exogenous shock causes a spike in volatility.
Margin and repo haircuts jump, and
The fund has to sell Treasuries into a market where everyone else is selling too.
Prices fall, yields spike, and the spike triggers the next margin call.
As is always the case, that is the cruel arithmetic of leverage. The same borrowing that magnifies the gain magnifies the forced sale.
If you look at the chart above, you will notice that we have already watched this movie twice. The first time was in March 2020, when funds dumped roughly $180 billion in Treasuries in a matter of days, and yields spiked as the economy imploded. That is the opposite of what a “safe haven” is supposed to do. Only the Fed’s interventions, which drove its balance sheet toward $9 trillion, stopped the bleeding.
Then, in April 2025, the “Liberation Day” tariff shock hit the swap spread trade, causing an unwind of about $60 billion before markets steadied.
However, there is another side to this self-correcting event that matters as much as the initial cascade event.
The forced selling leaves the cash bond cheap, its yield artificially high, and that gap is extremely appealing to cash-rich buyers. A real-money buyer or a fresh arbitrageur steps in to lock the fatter yield, and their buying drags it back down, which is why the spike is usually temporary. Most of these basis-trade wobbles never make headline news, just the event that caused them.
Your next question is a good one.
“Why were March 2020 and April 2025 the exceptions?”
The reason those two periods were exceptions was that those reversals depended on three things holding at the worst possible moment:
A dealer with a balance sheet to finance the bond,
Cheap repo to fund a fresh trade, and
Unlevered real money is buying, not selling.
In a genuine dash for cash, all three of those factors arrive at once. That was March 2020 exactly, when mutual funds dumped another $270 billion right alongside the hedge funds, so the natural stabilizer just became an additional seller. When the three hold, the reversal is a blip. When they jam, yields overshoot, and the only buyer left with the size to stop it is the Fed. The chart below traces the full sequence: the doom loop on the left and the buyer who ends it on the right.
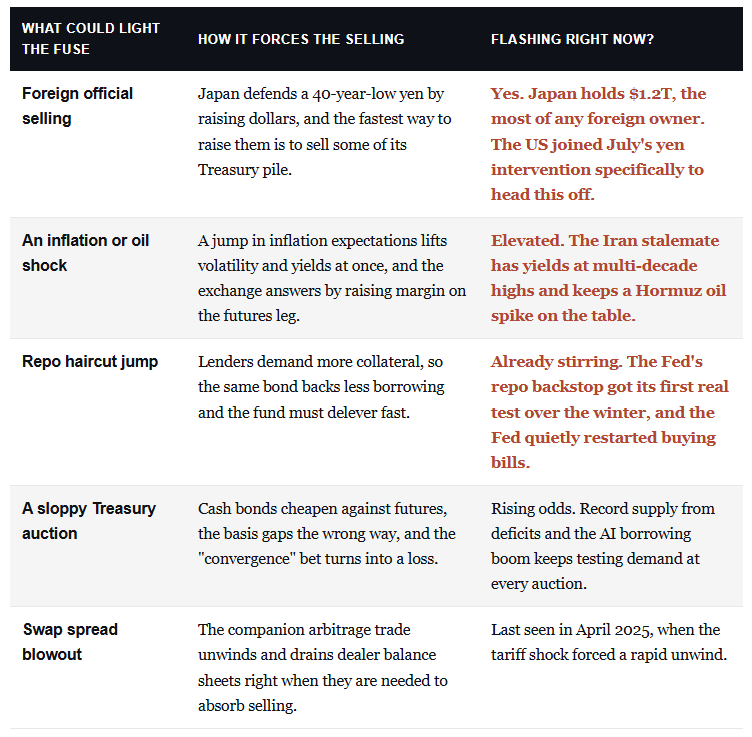
This time, the fuses are not hypothetical. Japan, the largest foreign holder at $1.2 trillion, is defending a yen at 40-year lows. Such is why Washington decided to join Tokyo’s yen intervention in July to mitigate the risk of an isolated event from spreading.
Secondly, the “Iran stalemate” has pushed yields to multi-decade highs and continues to impact the real economy through an oil shock. Furthermore, the plumbing is already creaking: the Fed’s repo backstops saw their first real use over the winter; the Fed quietly stopped shrinking its balance sheet and restarted buying bills; and just this week, the Treasury doubled its long-bond buybacks to fight the sell-off. When the government is already reaching for the fire hose, there is smoke in the building.
Which brings us to the real question.
“If the basis trade blows up, will the Fed step in?”
Almost certainly, in the end. The Treasury market is the one market monetary policy cannot function without, and the tools are already built: a standing repo facility for domestic funding stress, the FIMA facility for foreign central banks like Japan, and, at the extreme, the same unlimited buying that stopped the last two episodes. To wit, the Fed’s own economist has already put the risk on the record.
“The combination of large scale, high concentration, and elevated leverage creates the potential for systemic stress if multiple strategies face simultaneous pressure or if severe shocks affect the largest participants.” – Federal Reserve, Decomposing Hedge Funds’ U.S. Treasury Exposures, June 2026
However, the fireman is different now, and that matters more than the market likely wants to admit. Kevin Warsh took over in May after years of arguing that the crisis backstop gets reached for far too freely. He wants a smaller balance sheet, and he blames the old regime’s bond buying for enabling government overspending.
Warsh is also rewriting how the Fed and Treasury work together. On top of that, add the moral-hazard problem that policymakers now openly discuss: a guaranteed rescue just invites investors to lever up more, and you get a Fed likely to let the basis trade take real losses before it acts.
Such is the new reality. The “Fed put” on the bond market is not gone. It just has a higher strike and a slower trigger than under Powell, which means the overshoot before your rate reversal arrives is likely bigger, not smaller.
What Should Investors Do Now
So where does that leave you? Not in a bunker, but not asleep either. The current setup is going to reward investors who can read who read the tape correctly, not those who react to every headline.
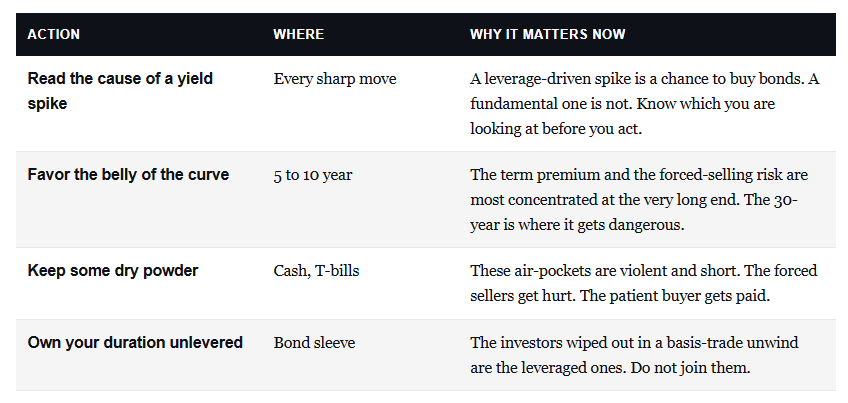
None of this argues for panic, but just for reasonable respect for the risks. As Lacy Hunt has been warning, and as we covered in Lacy Hunt Turns Bearish Bonds, the old rules for owning duration are shifting under our feet. The basis trade is one more reason the bond market is no longer the quiet corner of the portfolio. Do NOT mistake a leverage-driven spike for an economic message, or an economic message for a leverage-driven spike. Trade accordingly.
📊 Market Statistics & Analysis
Weekly technical overview across key sectors, risk indicators, and market internals
💸 Market & Sector X-Ray: Market Gains Ground
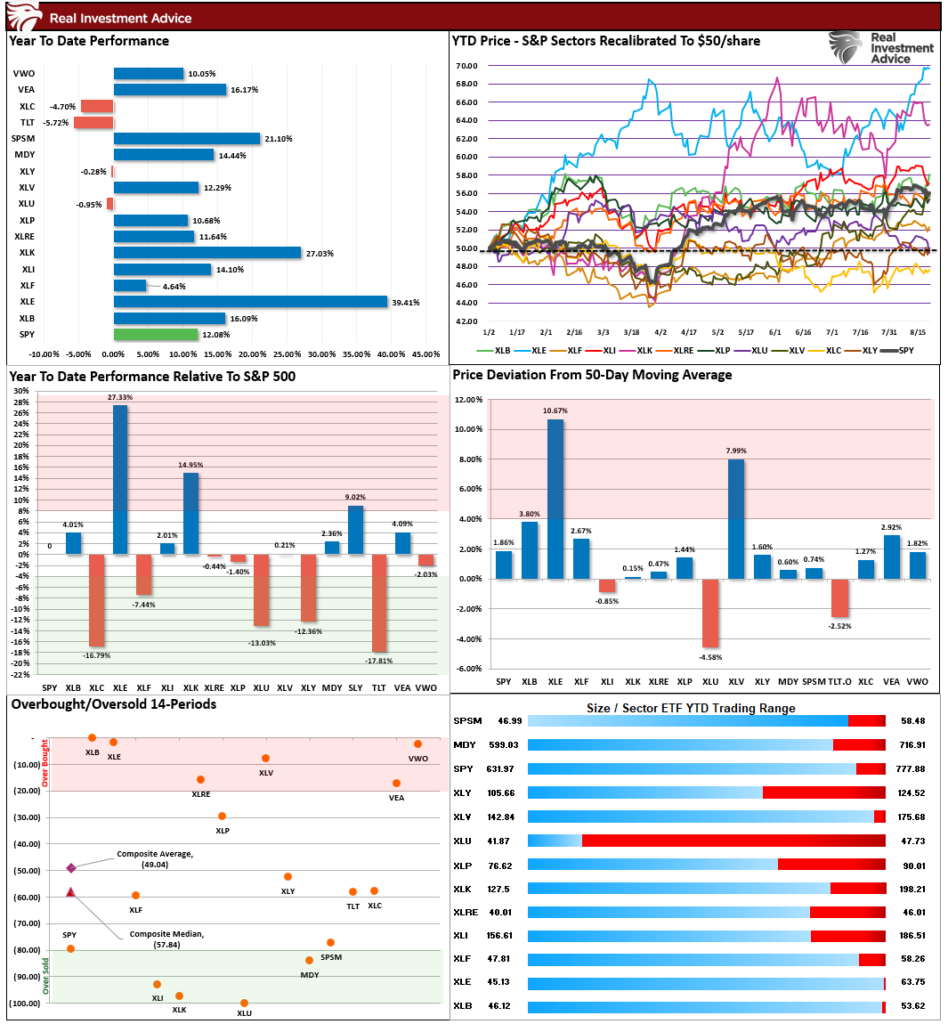
The market struggled a bit this past week Energy took the lead with rising oil prices. Overall, the market remains well deviated above longer-term moving averages but has reversed some of its previous overbought conditions. Staples, Energy, Materials, International and Discretionary are overbought, while Utilities, Technology, and Industrials are oversold.
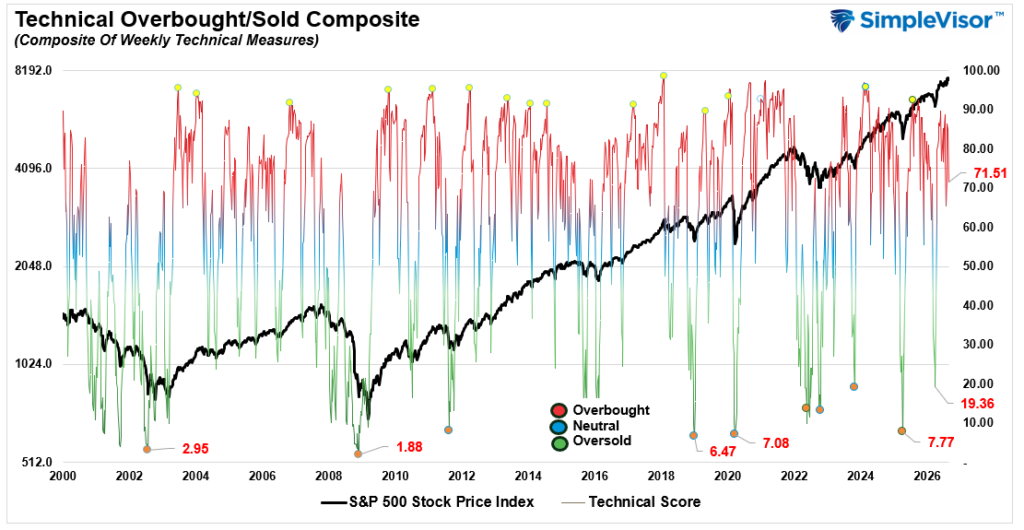
📐 Technical Composite: 71.81 – Overbought Reversing
The technical condition eased slightly again this past week but the market remains overbought, and sentiment remains bullish for now with no significant technical breaks. Indicator does suggest more struggles for the market next next.
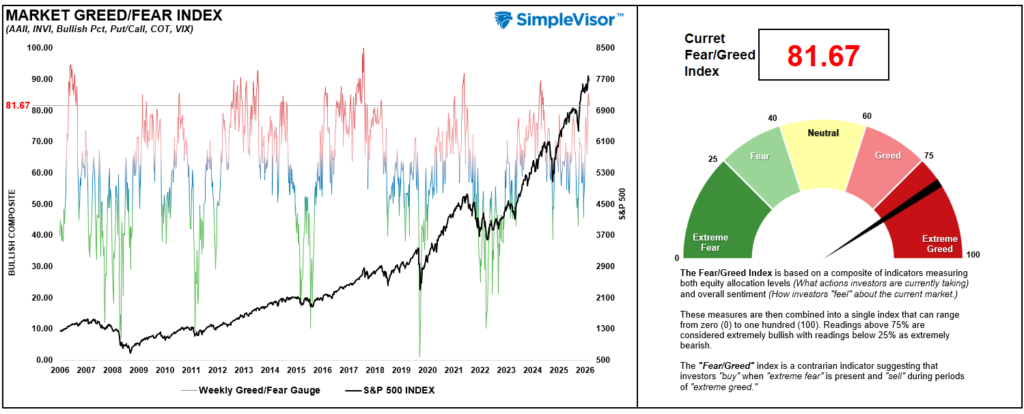
🤑 Fear/Greed Index: 86.63 – Extreme Greed
The recent push in the market brought investor positioning and sentiment along with it. From a “how are investors positioned” perspective, investors remain very bullish on the market and show no real signs of concern. However, these levels are historically present near short-term market peaks and consolidations.
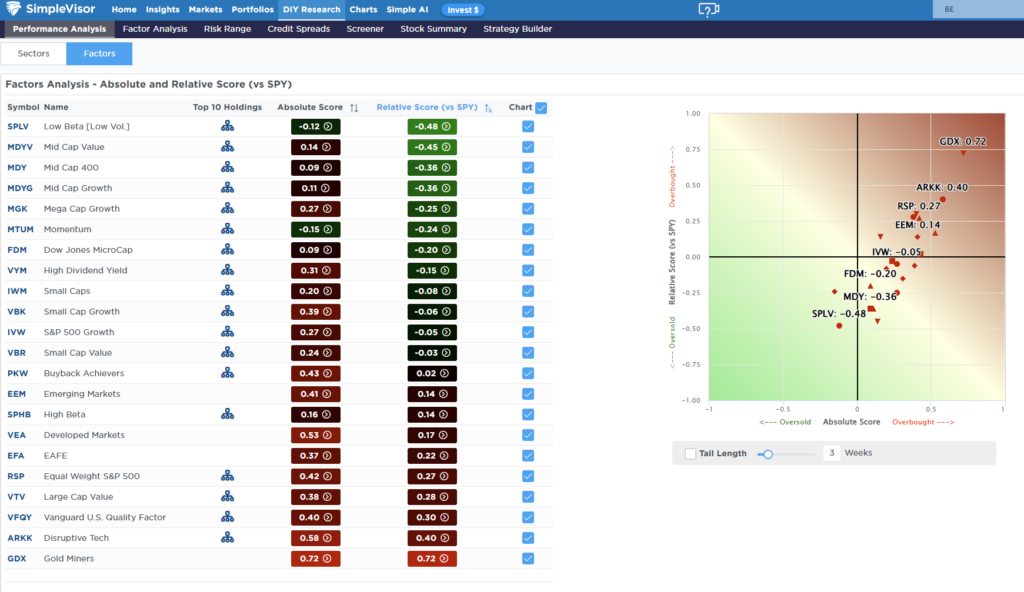
🔁 Relative Factor Performance
About 12-weeks ago we noted that Goldminers (GDX) were the most oversold factor on the list which suggested that a rotation was likely. That rotation has now occurred and Goldminers are extremely overbought. Take profits and rebalance your positioning. Disruptive Tech, US Qualrity, Large Cap Value, and Equal Weight are also very overbought suggesting we could see a bit more of correction in the market over the next few weeks and see a rotation towards lower beta and technically beaten up sectors.
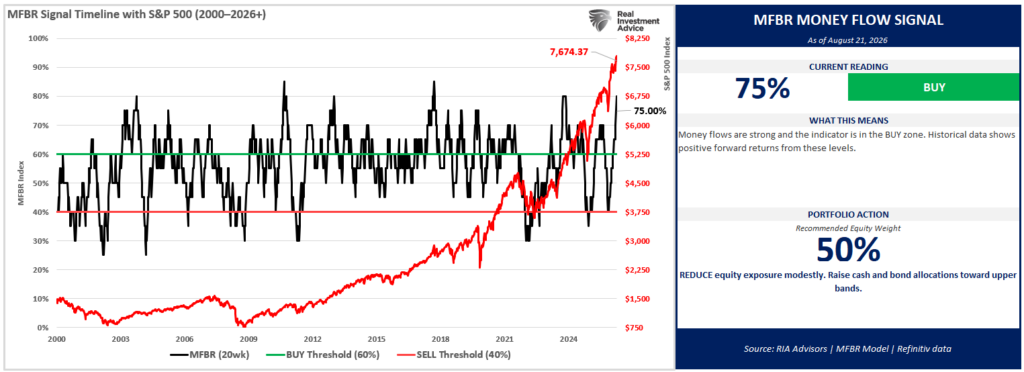
📊 MFBR Index (Money Flow/Breadth Ratio Indicator)
The Money Flow Breadth Ratio (MFBR) model is a rules-based equity allocation framework that uses weekly S&P 500 money flow data to generate buy, sell, and neutral signals. The MFBR systematically adjusts portfolio equity exposure in response to the direction and persistence of institutional capital flows. It aims to reduce drawdowns while capturing the majority of market upside.
“As of August 21, 2026, with the S&P 500 at 7,674.37, the Money Flow Breadth Ratio (MFBR) stands at 75% and reversing, versus 80% the prior week – still a 10 percentage-point increase over the trailing four weeks. This places the indicator in extreme overbought territory (75% or higher). The raw breadth signal still reads BUY, but the MFBR is a contrarian indicator at extremes: readings this stretched have historically been followed by below-average forward returns, so the model treats this as a caution flag rather than a green light to add risk.
The model’s 25-year backtest is the reason for the trim: MFBR readings above 70% have been followed by below-average forward returns, so the grid reduces exposure at these levels rather than adding to it.
Breadth this stretched is a profit-taking signal, not a chase signal. The model’s message is to sell into strength, move down to the target weight, and reassess next week.”
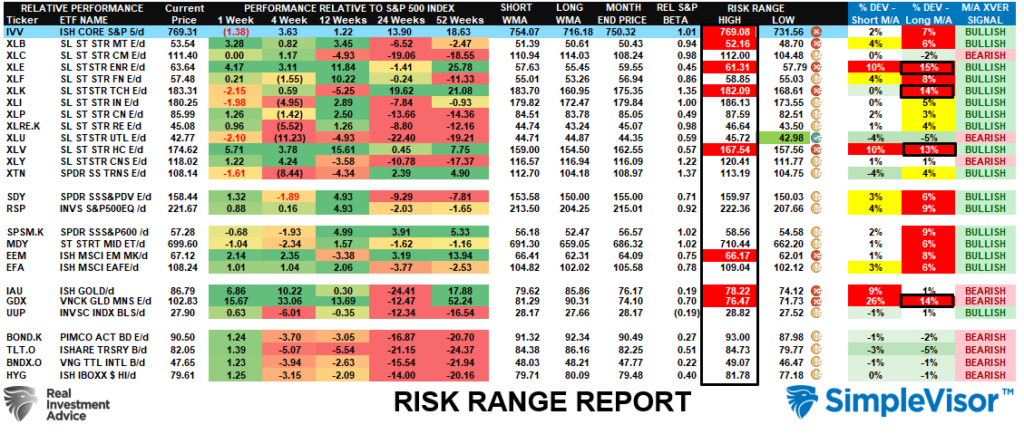
📊 Sector Model & Risk Ranges
Last week we noted that “These extremes are often a good signal to take profits and rebalance, and such is the case now with markets overbought, stretched and excessively bullish.” That turned out to be good advice given the turmoil this past week. Gold and Goldminers are once again grossly extended so taking profits is recommended along with Energy exposures as well.

Comments
Log in or sign up to join the conversation.