


Markets had a rough week. The SMH fell more than 11%, the Nasdaq nearly 5%, the S&P 500 nearly 3%, and the IWM about 2%. It was the election that everyone liked until they didn’t.
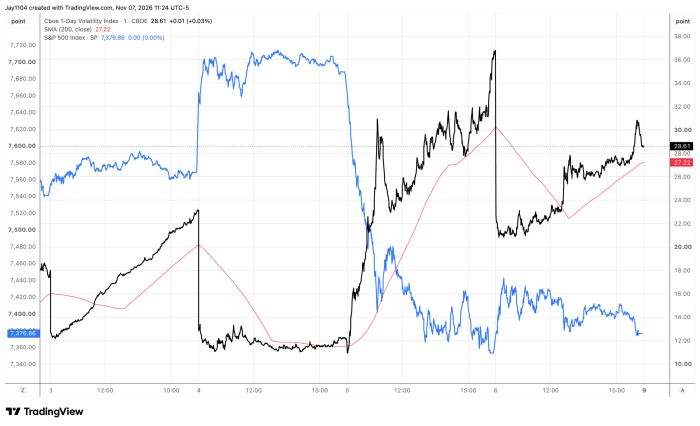
Going into the midterms, the 1-day VIX rose to about 23, a reading more typical of a jobs report or a CPI print. That implied a move of roughly 1.4% for Wednesday, and the S&P 500 rallied about 1.58%. On Thursday, it gave it all back.
The vol crush masked what was happening beneath the surface. On Wednesday, the SMH gapped lower and finished down almost 3% while the equal-weight S&P was up nearly 2% and the Nasdaq only 90 basis points. The market was telling you it didn’t love the outcome, at least not for semiconductors. The rally itself was mostly dispersion. Implied volatility fell, premiums decayed, and hedges were unwound; with technology weighing on the index, the rest of the market had to do the lifting. That is why dispersion rose on Wednesday when it should have been falling.
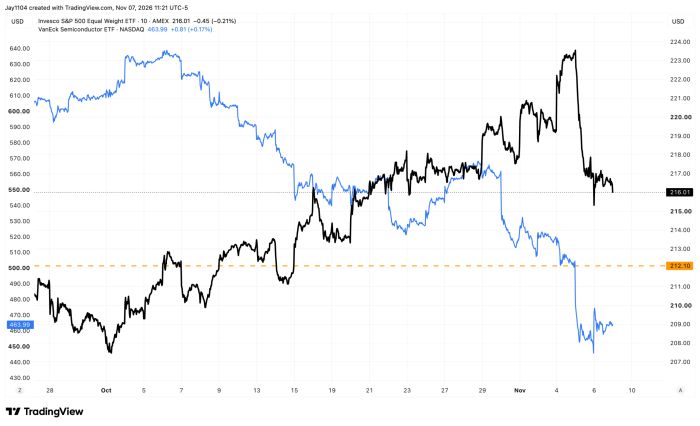
By Wednesday’s close, the VIX model said the index was about where it should be given single-stock volatility and implied correlations. The VIX had no more room to go down, so the market would have to go higher on its own. The problem is the S&P 500 has been underperforming the equal-weight index, which tells us the AI-led trade has been underperforming. On Thursday, there was no volatility left to crush; people still wanted to sell semiconductors, correlations went up, and the whole market turned.
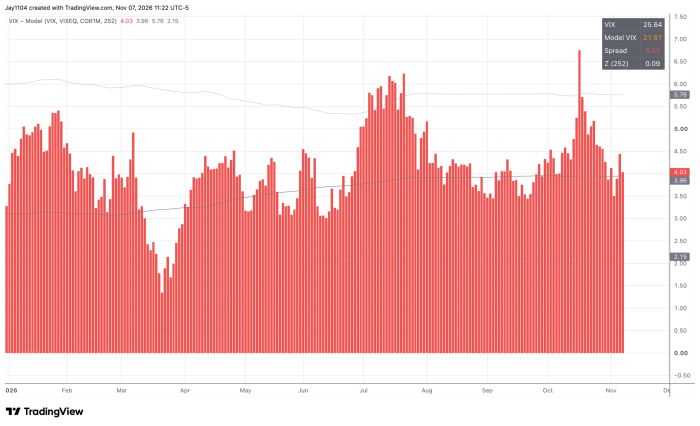
Thursday’s close left the 1-day VIX at 36.8, which implied a big rally on Friday after the jobs report. Volatility did come down, to around 21, but the S&P 500 finished up only about 30 basis points. As volatility bottomed, the index topped. That doesn’t give me much confidence in a rally this coming week. The model says there isn’t much volatility to crush here. Unless correlations fall and single-stock volatility climbs faster than the VIX, I think it will be hard for the VIX to go down. Seasonally, we are outside the window too, since dispersion typically unwinds and correlations rise once the mega-caps have reported.
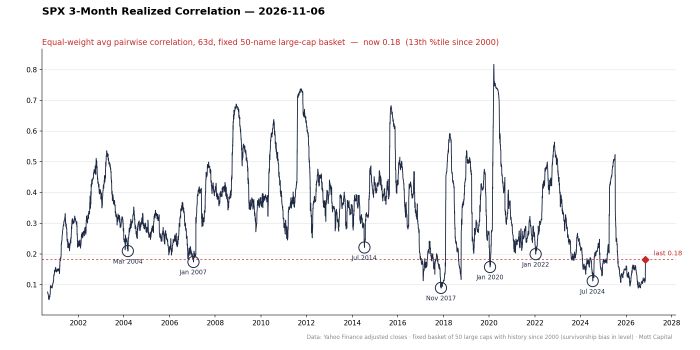
One-month implied correlation at 20 is high relative to recent months but low historically. That low-correlation, high-dispersion regime has been the AI trade, with Nvidia (NVDA) carrying the index and Micron (MU) and Broadcom (AVGO) entering the top ten. If those names stop working, I think the market is more likely than not to keep unwinding. Three-month realized correlations rose sharply this week, and bottoms like this have tended to lead to fast increases and more volatility. Across the top 50 S&P 500 components, put implied volatility is now elevated, so the options market turned bearish on the components very quickly. Now add a strong jobs report, with CPI on Tuesday (11/10) and PPI after it, keeping implied volatility bid at least through Tuesday morning. A hotter core CPI is something I have been looking at, based on the ISM readings.
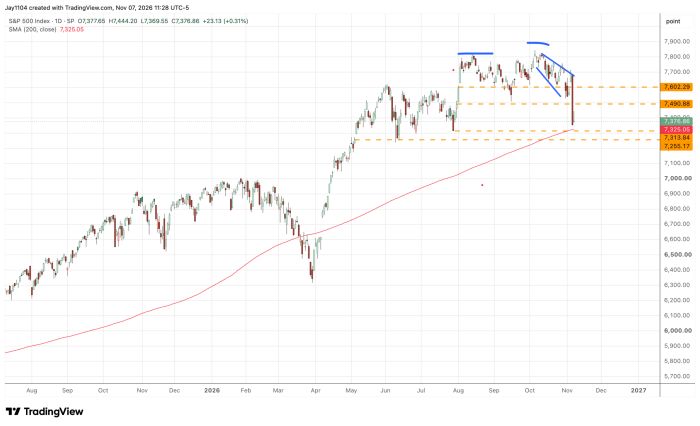
The technicals are not helping. The S&P 500 is sitting on an important support level, and a break would probably set up a move toward the next area lower. The Nasdaq has already broken the July lows, the SMH has a large open gap below, and Nvidia has broken its lower bound. Coming out of earnings, a lot of stocks have dropped 15% to 20% on results that didn’t seem all that bad, which again comes down to the options market. This market moves faster than any I can remember, so Thursday and Friday could prove to be an isolated event, but mechanically the market could still have further to unwind, and I think one needs to be very careful around that.



Comments
Log in or sign up to join the conversation.