

Let’s set politics aside today and focus on the stock market.
From a technical analysis perspective, the market has become extremely overstretched and is due for a correction.
The S&P 500 is trading above its monthly Bollinger Bands to the upside (red circle in the chart below). This means the stock market is now three standard deviations above their average historic price.
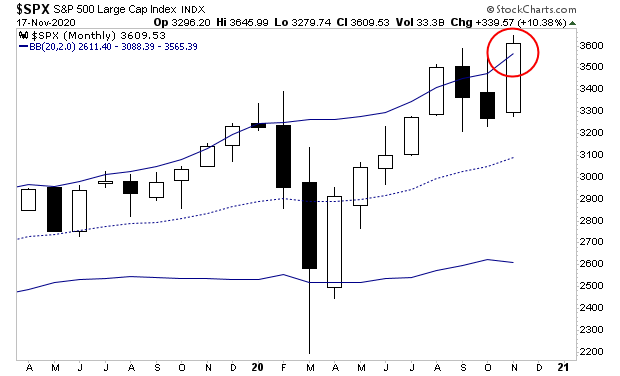
Any time stocks have performed a similar move in the last three years, it’s been quickly followed by a sharp decline, usually to the tune of 200+ points on the S&P 500.
You can see this for yourself in the chart below. I’ve circled the last similar three occasions in which the S&P 500 was three standard deviations above its average historic price.
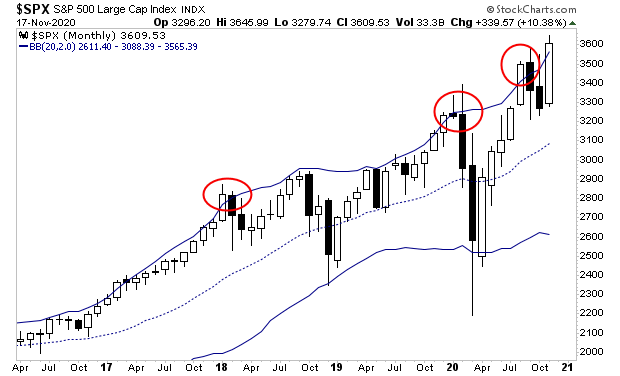
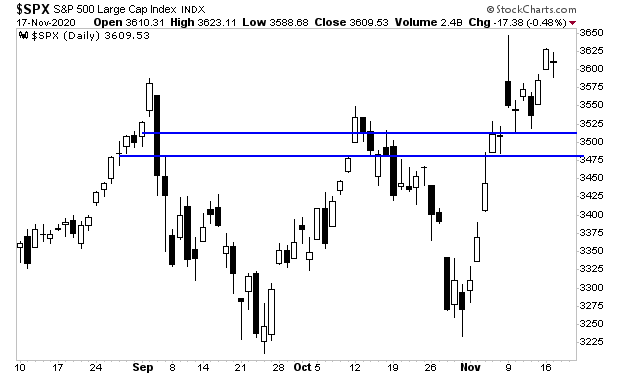
In simple terms, stocks are EXTREMELY overstretched and due for a breather. I’ve identified the lines of support at which I would expect stocks to be a “buy” in the coming days. Save your capital for now, and prepare to buy around those levels.


Comments
Log in or sign up to join the conversation.