
A bullish reversal is indicated as the Tadawul All Share Index (TASI) (Saudi Stock Market) breaks out of a head & shoulders bottom reversal pattern at the start of the week. The pattern formed following the completion of a 78.6% Fibonacci retracement of the near-term downtrend.
(Click on image to enlarge)
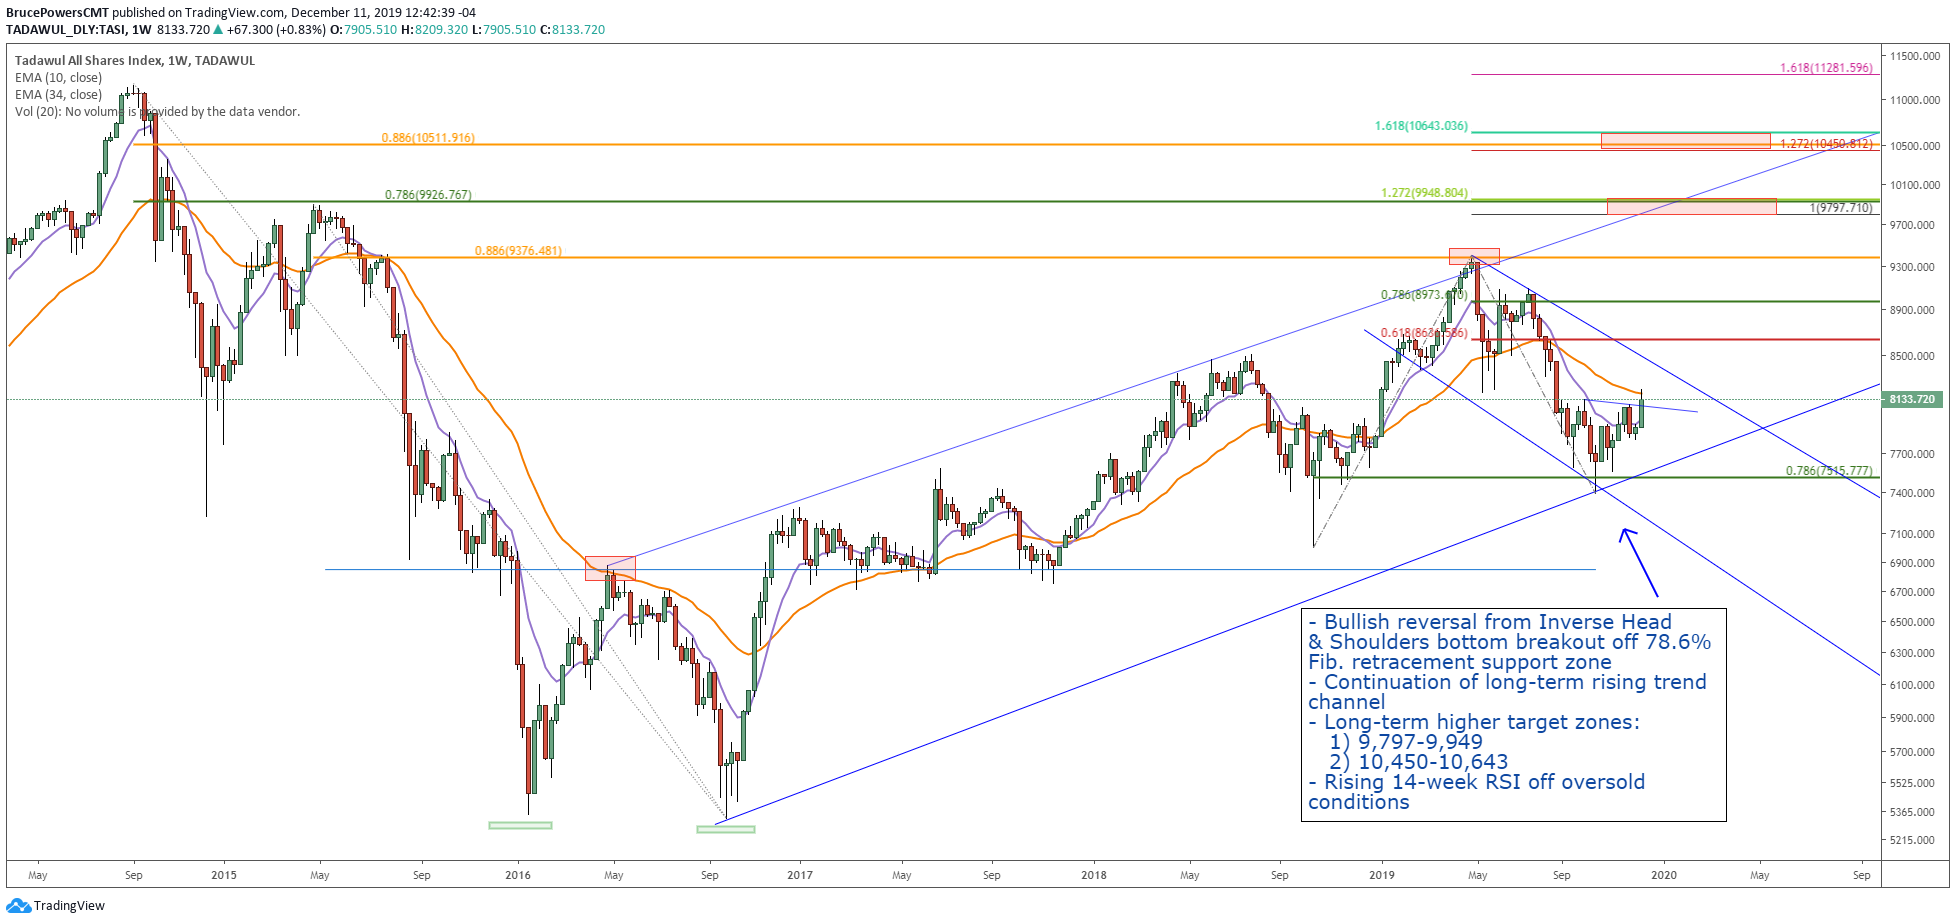
A continuation of a long-term uptrend channel can be anticipated with an eventual rally back to the top of the channel. Fibonacci retracement and projection levels are marked on the enclosed charts to identify potential near and long-term price targets.
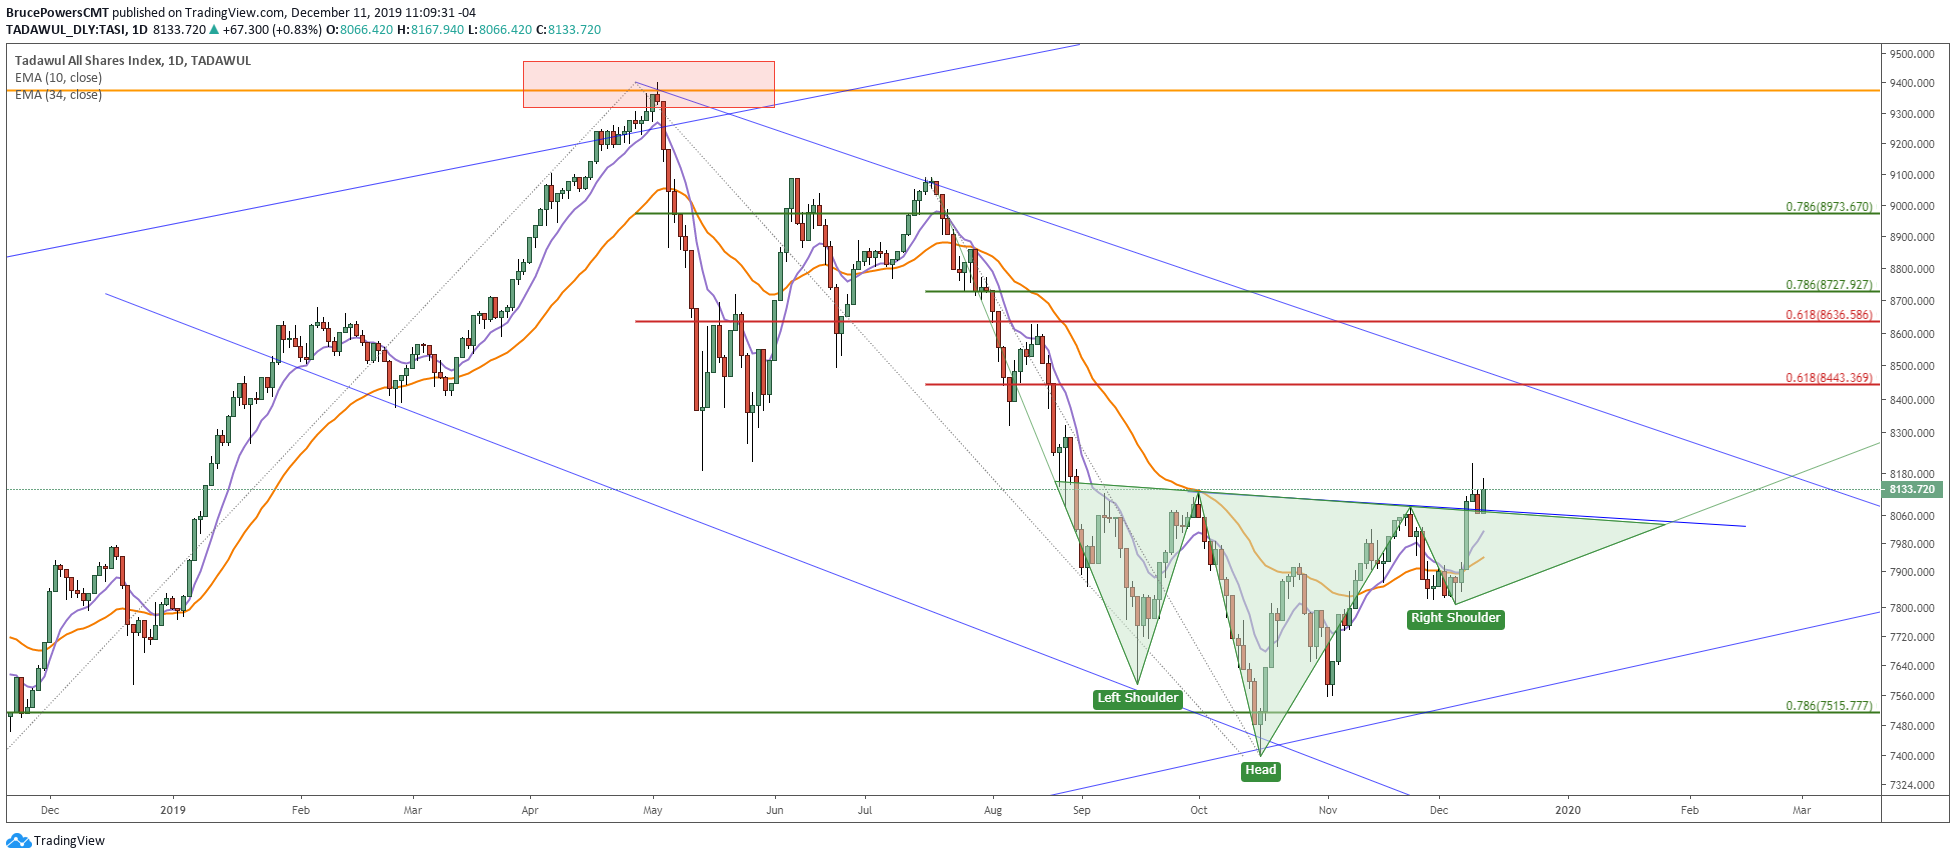
Nevertheless, a decisive daily close below the head at 7,396.60 is a failure of the above bullish scenario, while a daily close below the right shoulder at 7,808.54 puts the bullish scenario at risk and requires a new assessment.
(Click on image to enlarge)
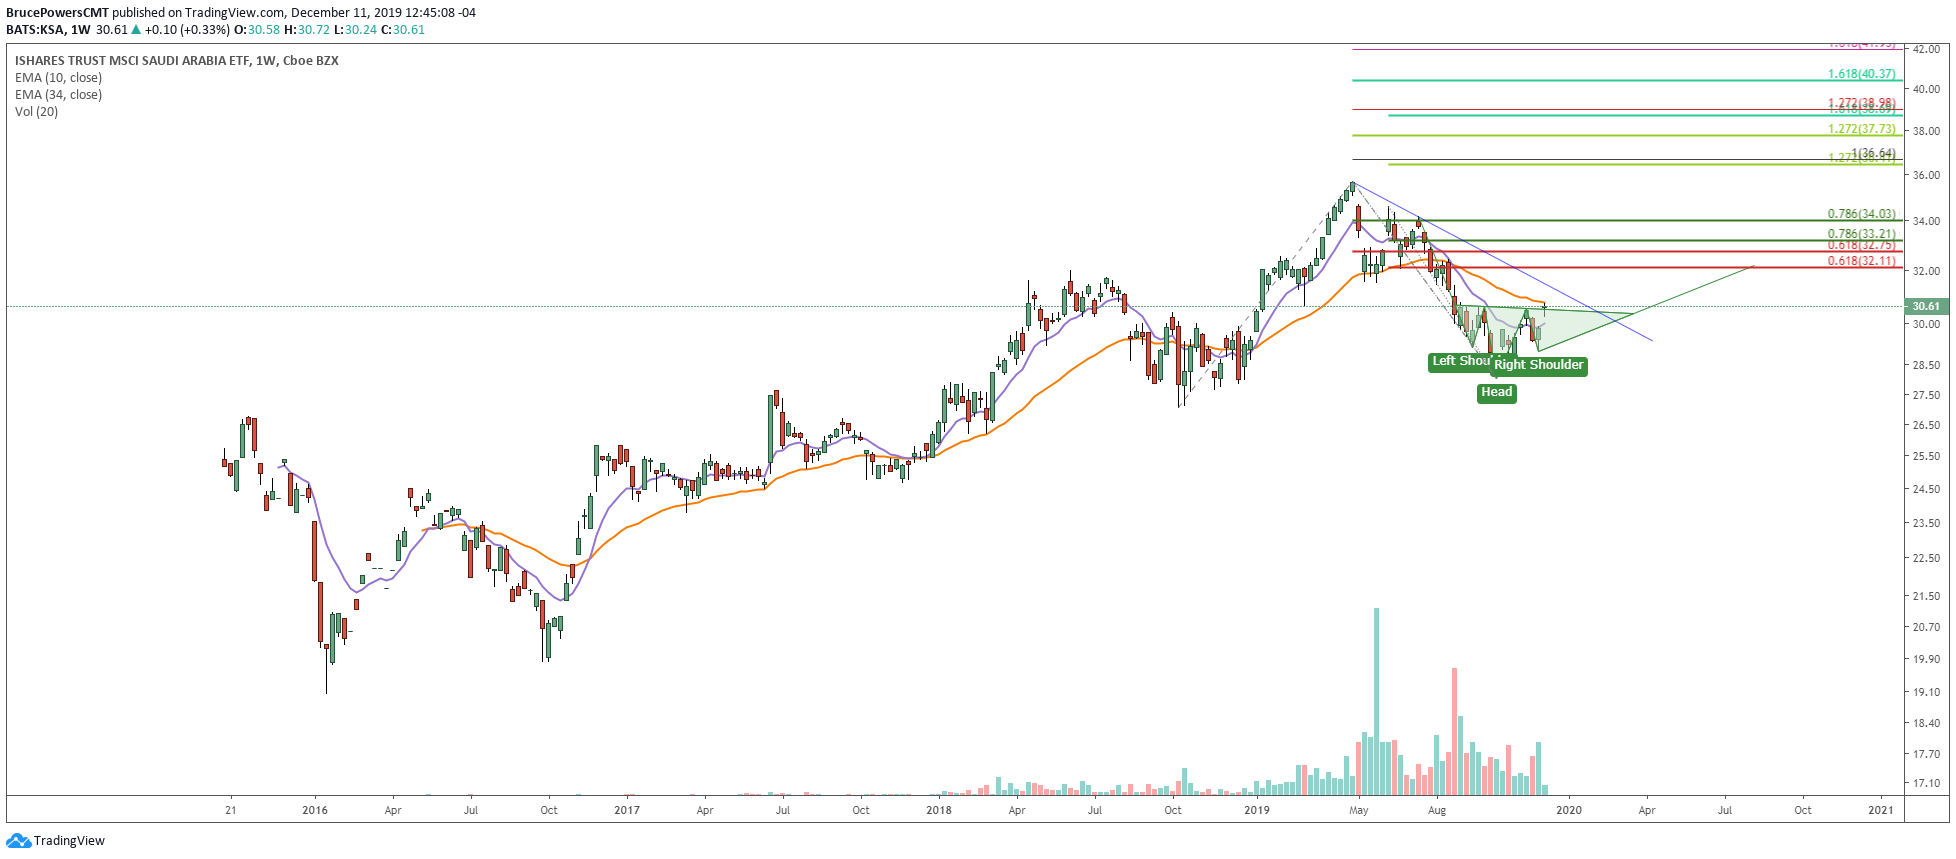
Investors in US markets can access the iShares MSCI Saudi Arabia ETF (KSA) ETF for exposure to the Saudi Arabia stock market. An upside breakout in KSA occurred this week as price closed above $30.56 on a daily basis. Support at the bottom of the right shoulder of the head and shoulders bottom reversal is at $28.97, while the bottom of the head is at $28.04. Fibonacci target levels for KSA are noted on the weekly chart below.
(Click on image to enlarge)

Comments
Log in or sign up to join the conversation.