
Traditional Markets
Markets are flying high today in response to some much-needed clarity on America's trade war with China.
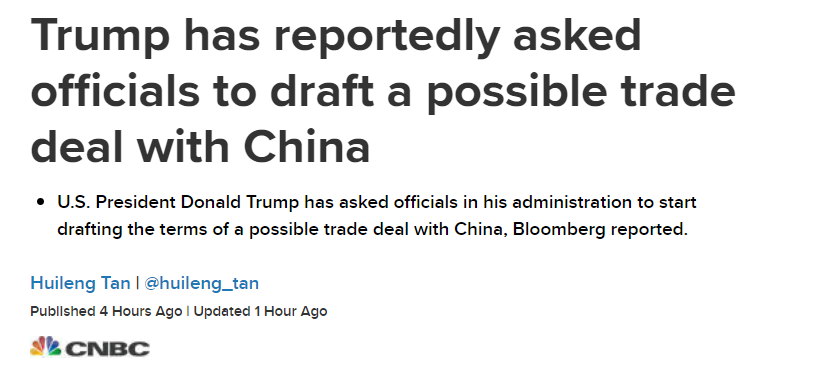
Apparently, Trump & Jinping spoke on the phone last night and patched things up.
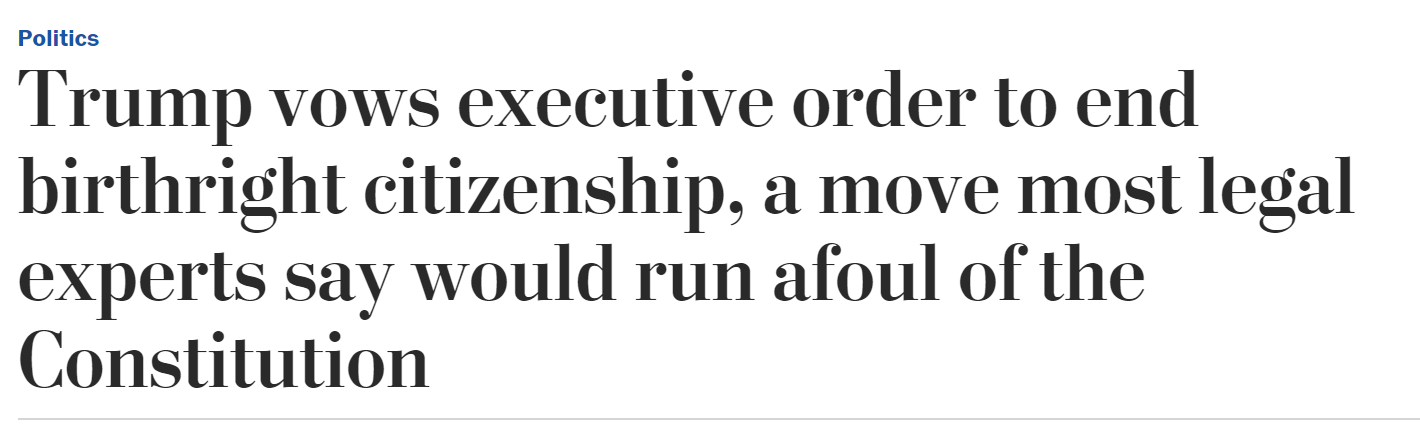
However, several commentators and analysts have pointed out that this entire episode could be a charade in preparation for the upcoming mid-term elections in the United States. President Trump has been ramping up his rhetoric lately, making statements like this one...
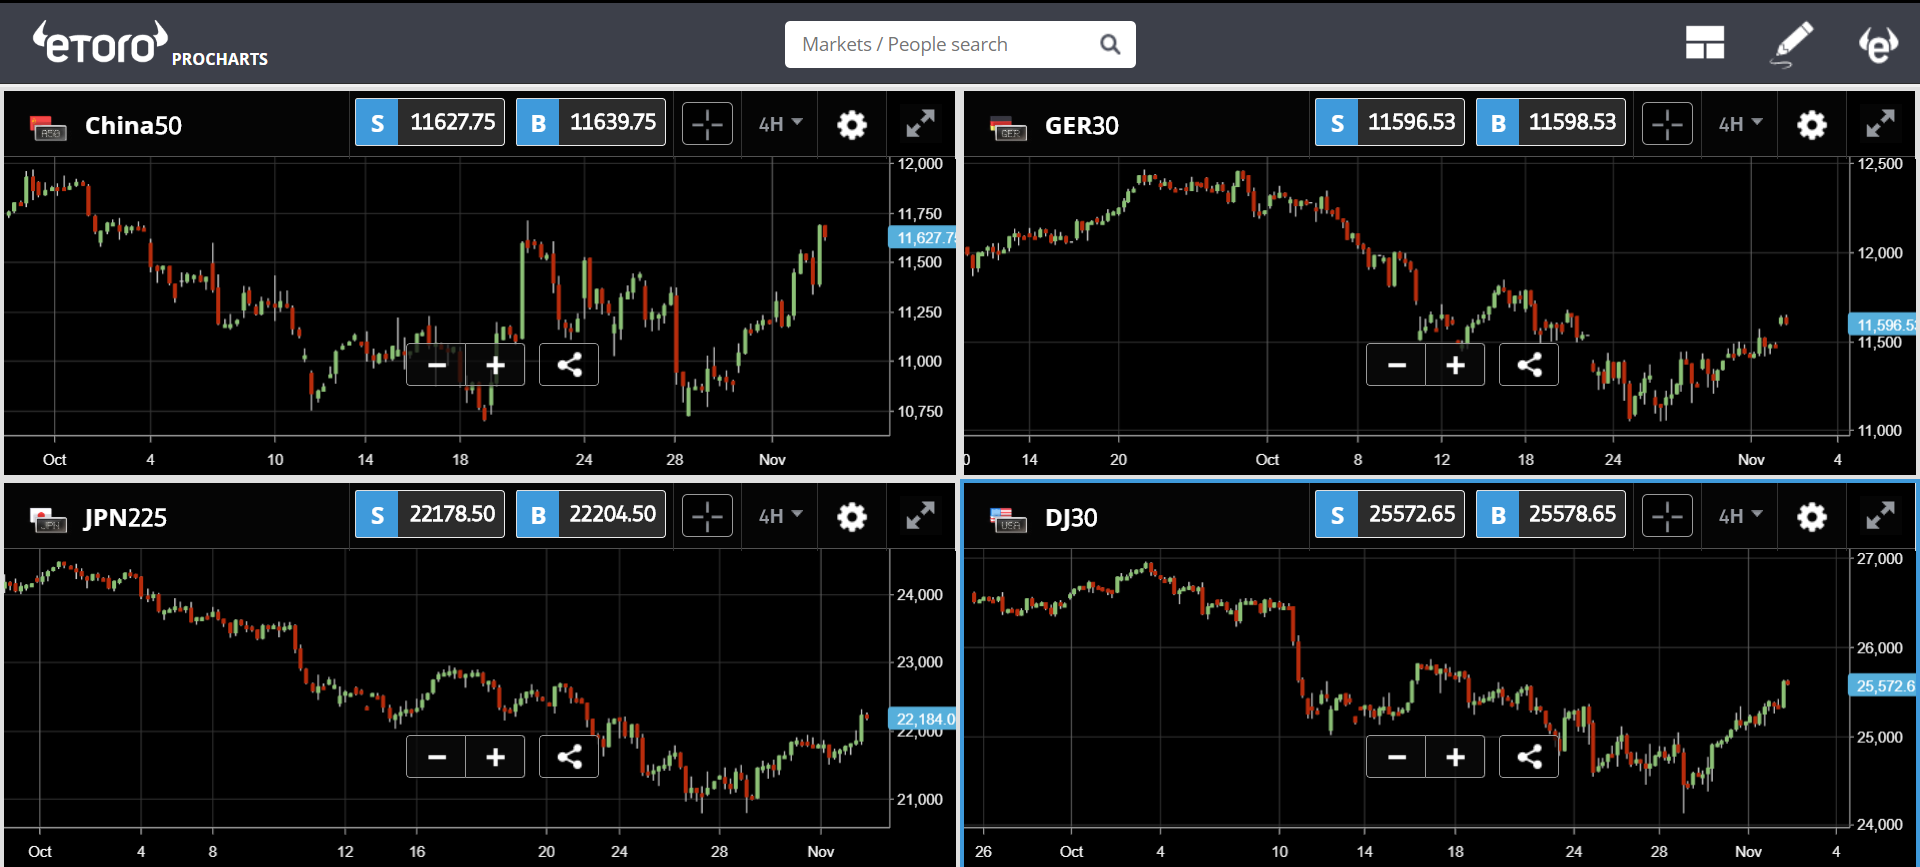
Whether or not this is a ploy for the benefit of the markets, it certainly is profitable for investors today. Indices are up across the board and we're currently seeing an incredible bounce off the recent lows.
These four charts show the damage done in Red October and the incredible start to November across the various regions.
Be aware of the timing around the NFP announcement today from the United States, which will be one hour earlier than normal for most traders due to the time difference and daylight savings.
Other Markets
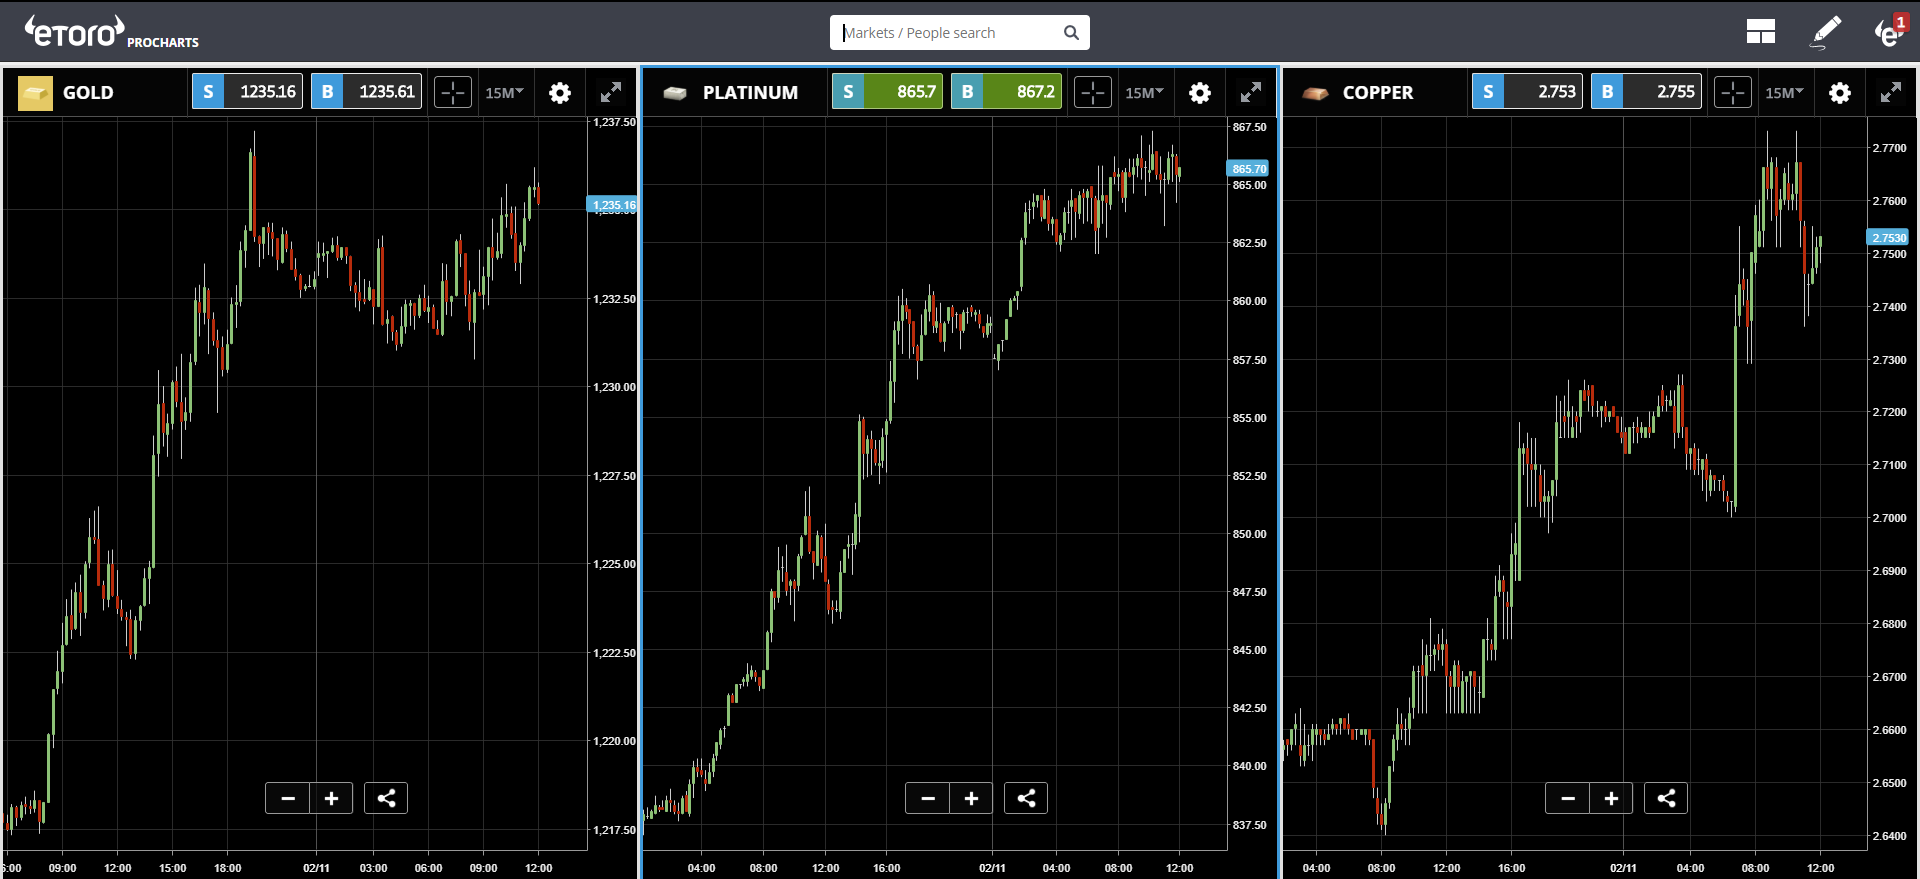
Once again, gold doesn't seem to believe the hype. Ignoring the rally in risk assets, the yellow stuff, along with other precious metals, continue its ascent today.
Oil is also shrugging off the risk on rally but for other reasons. Even though the new sanctions are set to kick in this Sunday, it seems that Trump has given several countries a pass to continue buying oil from Iran for the time being.
Crude oil is now at its lowest level since April and that monster momentum that we've been seeing build up over the last 14 months is now in question.

Bitcoin Cycles
The price of bitcoin and other cryptoassets remains flat but that's nothing new. This is simply a part of the cycle that we've seen play out many times in bitcoin's relatively short history.
This article that I wrote back in July outlines the various stages of surge, retrace, and relax. For today, I wanted to give more of a deep dive into the two previous cycles because, even though past performance is not an indication of future results, there's still a lot we can learn from history.
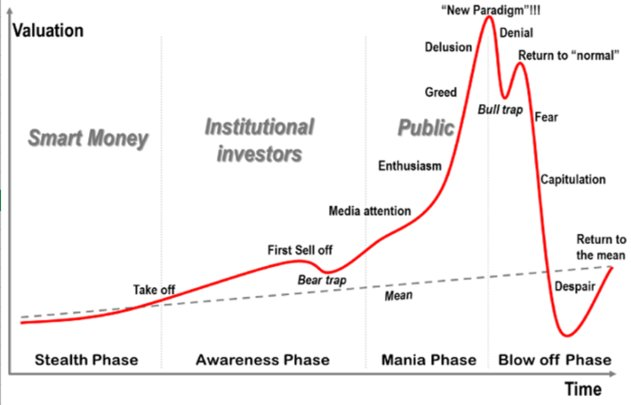
For a frame of reference, here are the normal stages of a financial bubble.
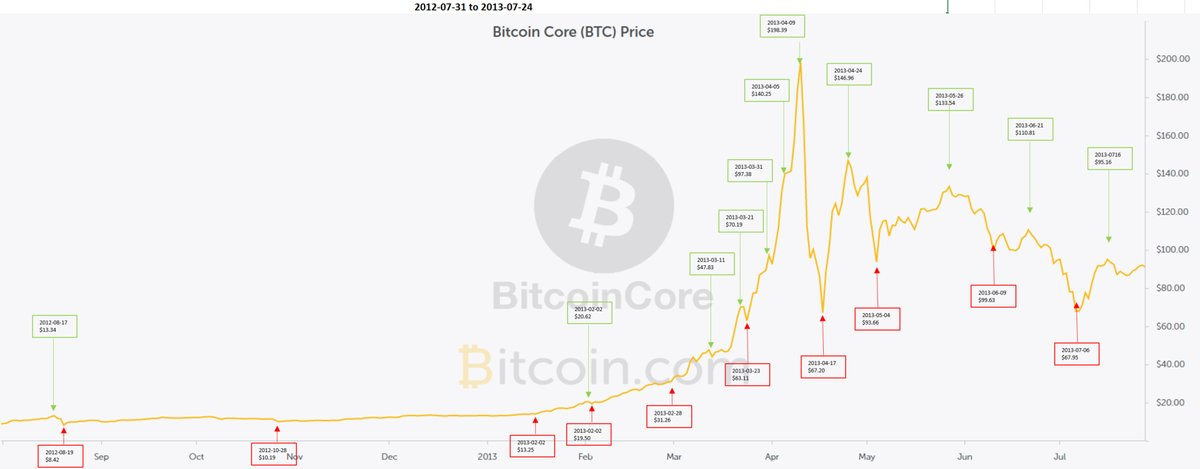
Here we can see bitcoin's second most famous price increase that began in 2012 and peaked in early 2013. Looks familiar, doesn't it? Look at the prices though closely though. The top of the chart here is less than $200 a coin.
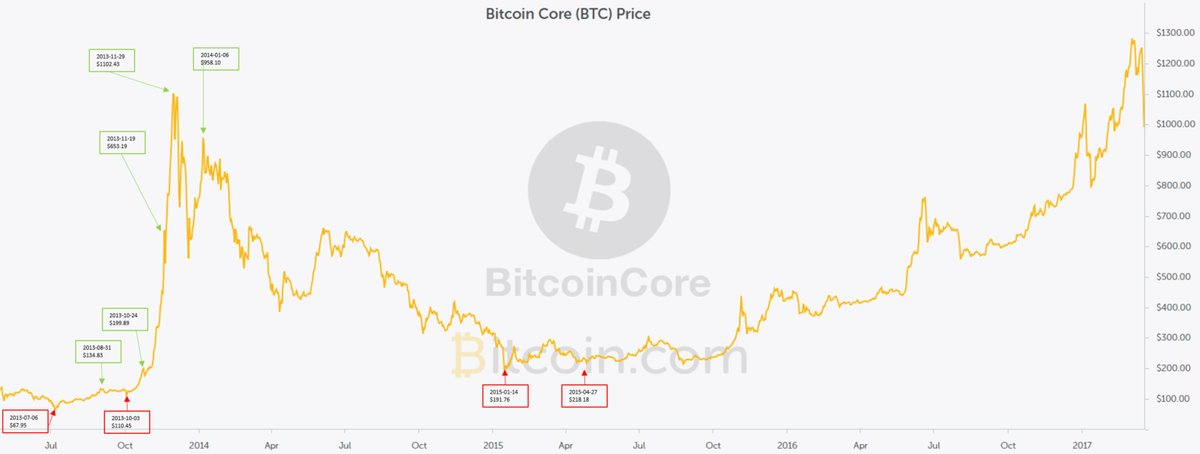
Later that same year we had another surge that brought us all the way above $1,000. This graph shows the peak of that price increase and the very slow gradual recovery that regained the all-time high in early 2017.
For this reason, Arthur Hayes of Bitmex has recently stated that the relaxation period could last for another 18 months. However, I tend to disagree.
This last surge that brought us all the way to $20,000 pushed bitcoin over the tipping point of mass awareness, and the following retracement and relaxation cycles have seen mass adoption by major financial institutions granting wider access to asset managers across the world.
My feeling is that, though we might see another low, as soon as prices start moving up, even gradually, many more people will be there taking notice.
However, the surge might not be quite as strong next time. The reason for this is the liquidity. Easy access and greater liquidity has a way of stabilizing prices so we might not see the same type of liquidity crunches that were common in 2017. But at the end of the day, the limited supply of 21 million coins imposed by Nakamoto will ensure a limited supply and that in itself creates demand on the long term basis.
For those of you attending the Blockchain summit in Malta this weekend, enjoy the event, wish I could be there with you!
To all my readers, have a beautiful weekend.


Comments
Log in or sign up to join the conversation.