

Strong bullish move for EUR/JPY as it decisively breaks out to a new trend high, and clearly moves above the 34-week exponential moving average (ema) (orange line on weekly chart below). The 34-week ema has acted as resistance since approximately September 2018. In addition, the internal downtrend line has clearly been broken, another bullish sign. The odds now favor a continuation of the uptrend begun off the September swing low of $115.86.
EUR/JPY Weekly Chart
(Click on image to enlarge)
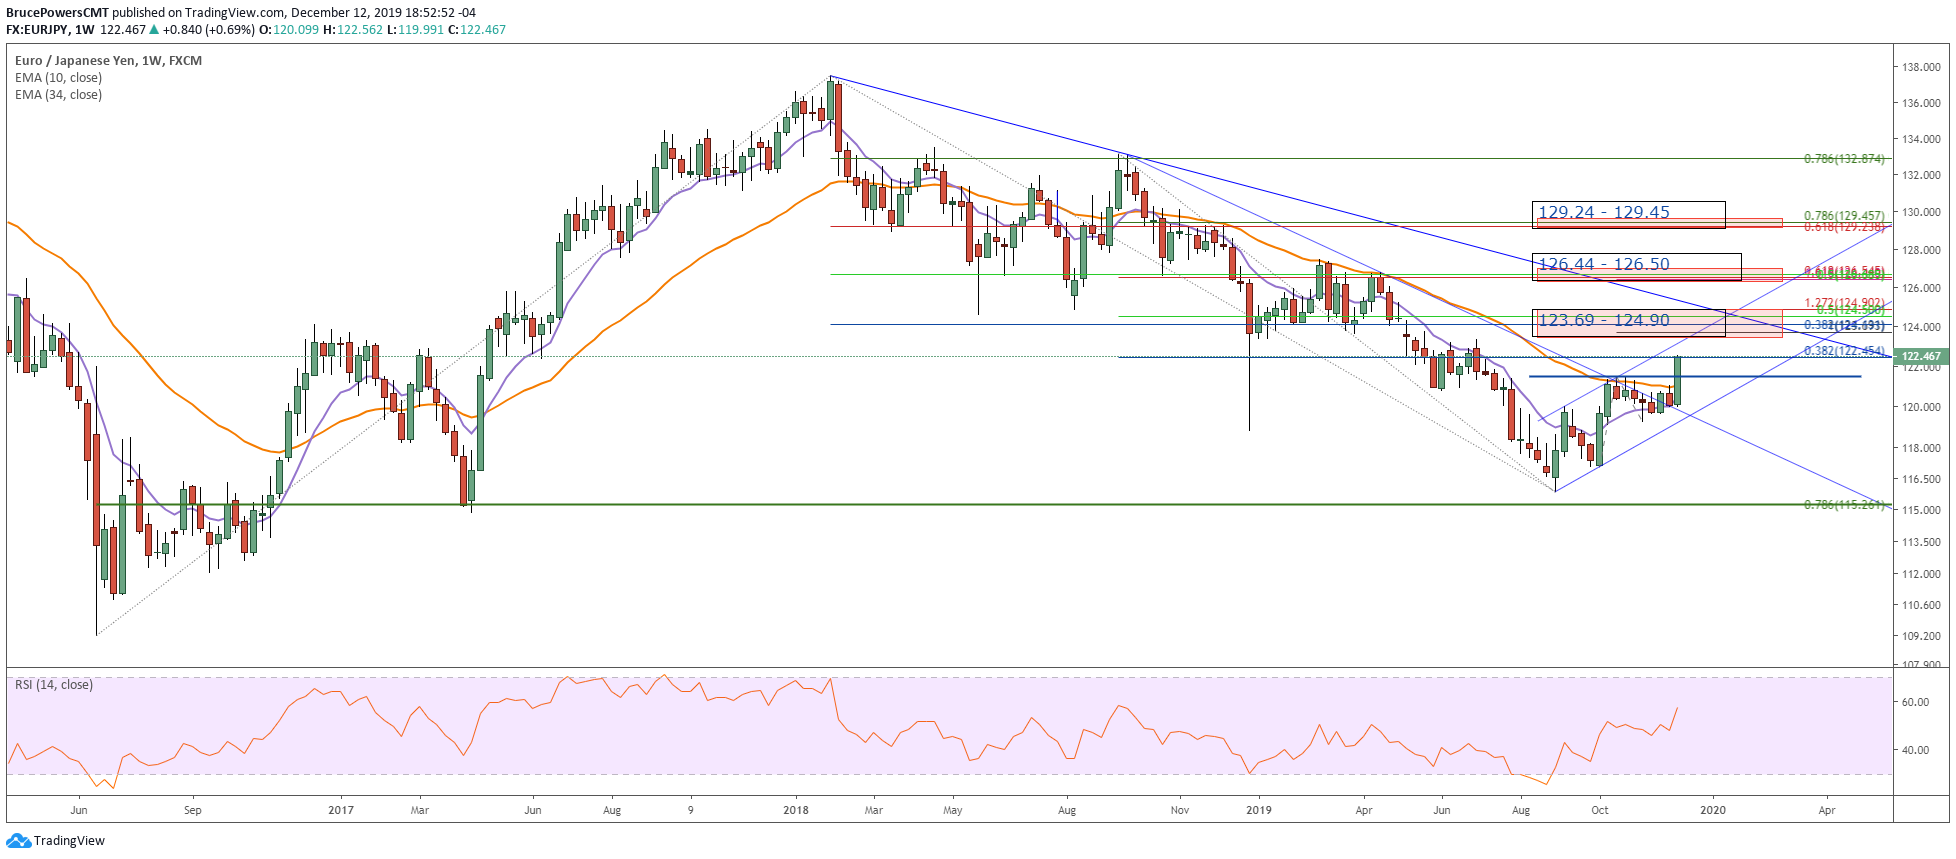
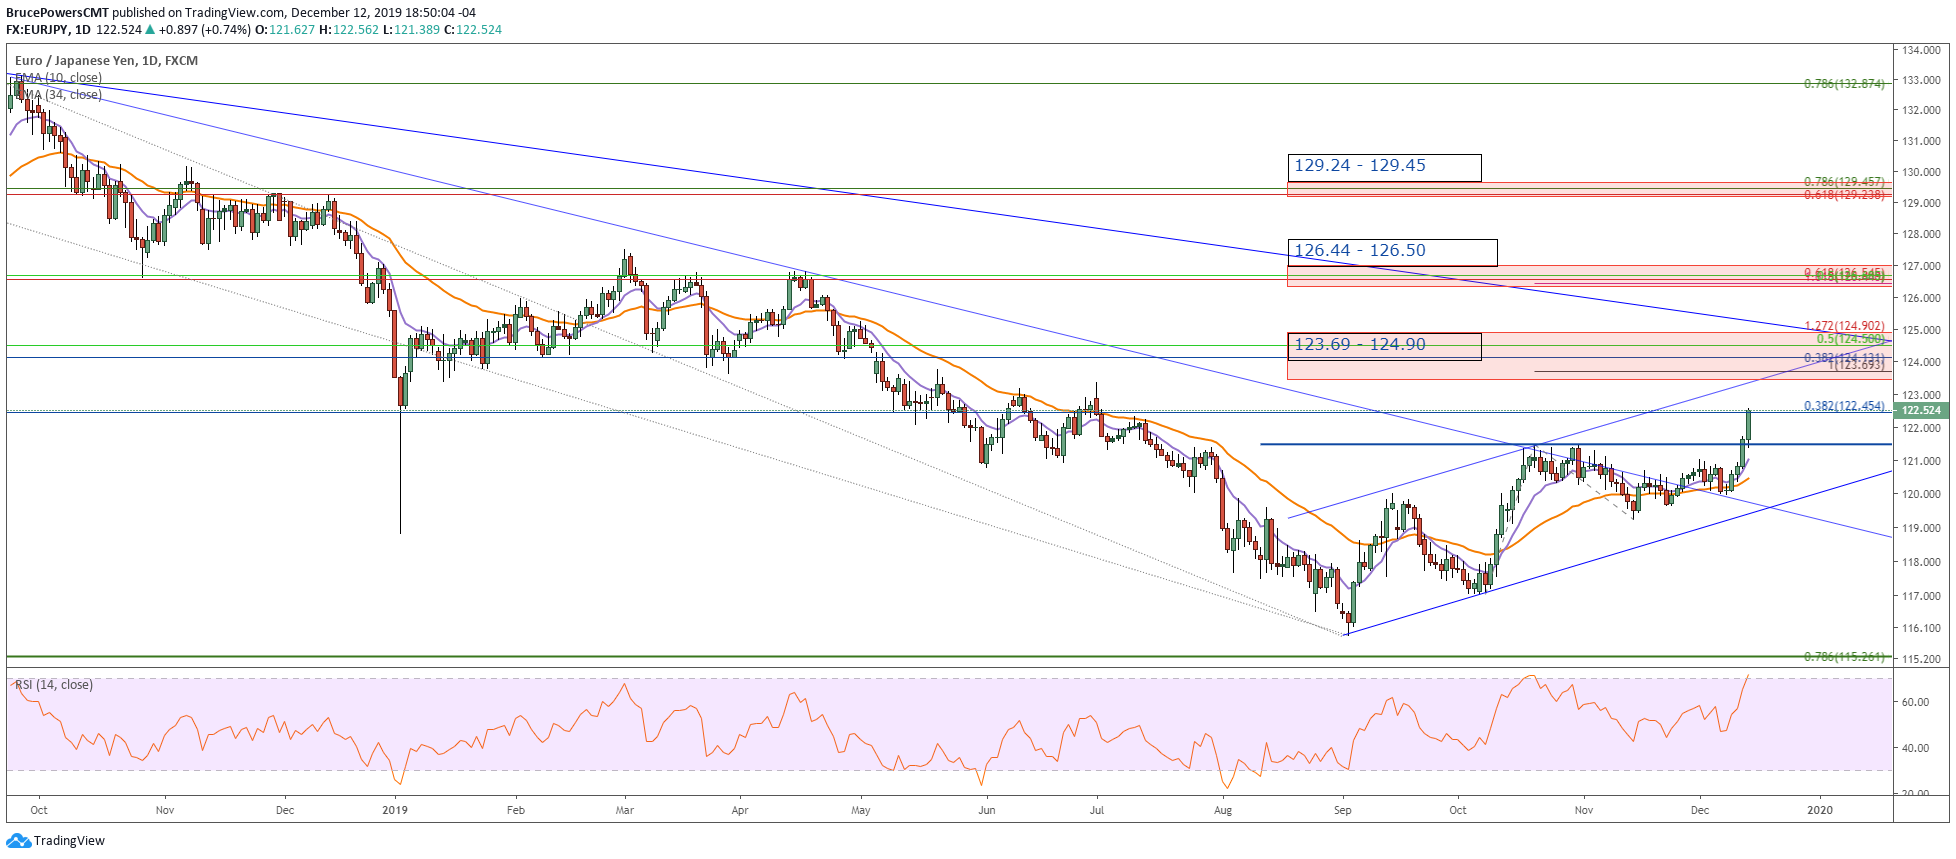
The EUR/JPY has already exceeded the 38.2% Fibonacci retracement at $122.45, of the full downtrend off the January 2018 high. Higher target zones as seen on the chart include approximately:
- 123.69 – 124.90 (38.2% retracement + several other Fibonacci levels, + previous support from 2018)
- 126.44 – 126.50 (50.0% Fibonacci retracement + several other Fibonacci levels, + previous support from 2018 swing low)
- 129.24 – 129. 45 (61.8% Fibonacci retracement + several other Fibonacci levels, + swing low support from first quarter 2018)
Next, watch for intraday retracements and subsequent buy setups for entries to take advantage of the developing larger bullish trend.
EUR/JPY Daily Chart
(Click on image to enlarge)

Comments
Log in or sign up to join the conversation.