

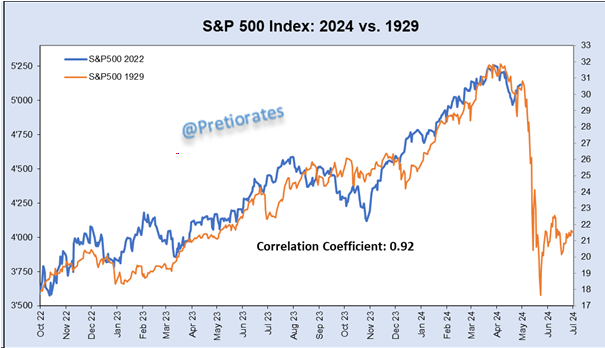
And once again we show the fractal chart of the S&P500, compared with the movements of 1929. The rule still applies: the chart works as long as it works and there is no confirmation that this time it has to happen again. On the contrary: in 90% of cases, fractal charts no longer correlate from an unknown moment. Nevertheless, the high correlation of +0.92 is astonishing...
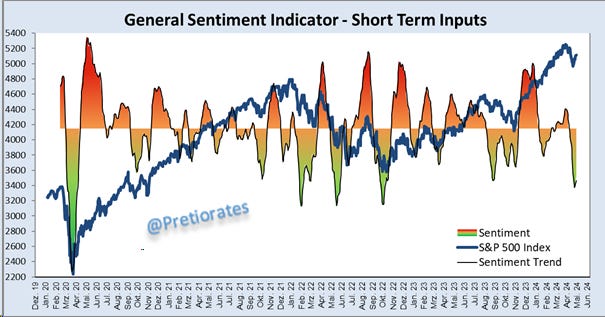
The short-term sentiment on Wall Street has recently been very negative and suggests that the recovery will continue...
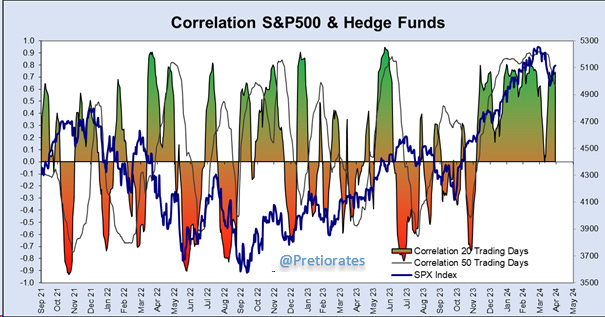
In the search for a possible trigger, we recognize that hedge funds are holding long positions like they haven't done for many years... too bullish?
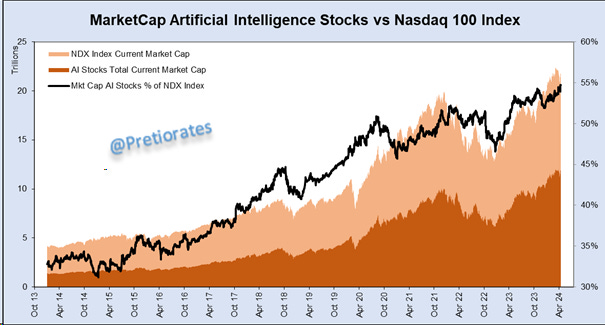
Or maybe AI stocks have consolidated recently, but their valuation compared to the overall market has reached new highs...
We still have a 'real' concern with the yen's movements. According to the latest COT data, the short positions in futures were expanded once again.... However, today was a typical key reversal day (new low, but on the same day a recovery above the previous day's price... cause for hope???
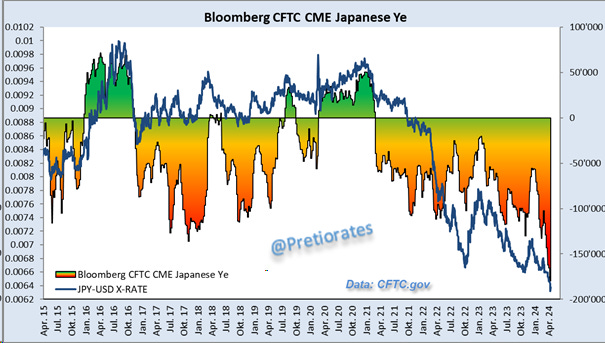
The Gold price has long since broken away from its correlation with the Yen and is showing its own strength. Just 10 years ago, the Yen was considered the 'academic' Gold - for those ‘studied’ investors who saw no sense in Gold...
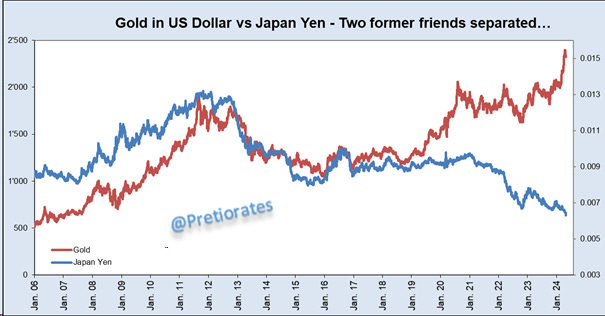
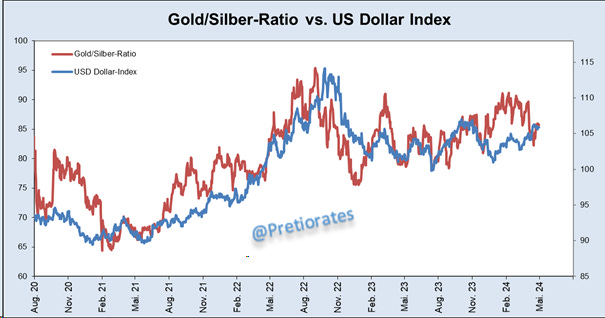
The US dollar index has a high correlation with the Gold/Silver ratio. This rises in economically positive times - and falls in bad economic times (Gold=security while Silver becomes more and more an industrial metal)...
The movements of Copper, which usually rises during good economic times, are striking. This week the ISM Manufacturing Index will be released... let's see if it confirms Copper's move...
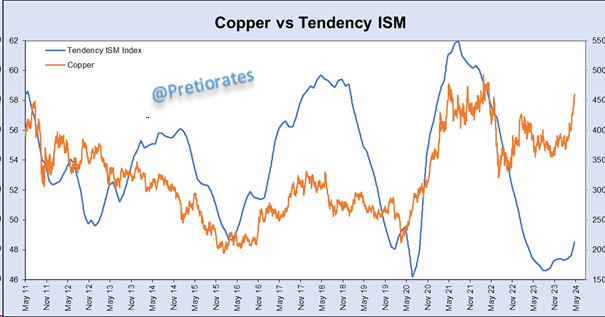
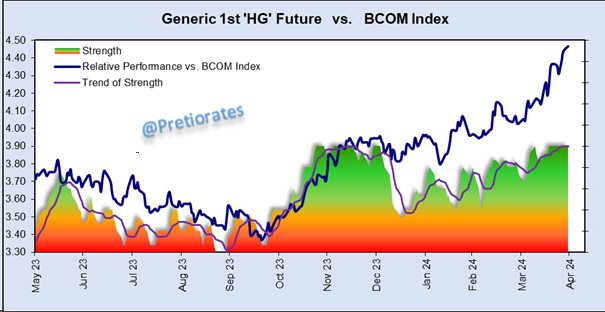
However, Copper's own strength is impressive and has been active since February...
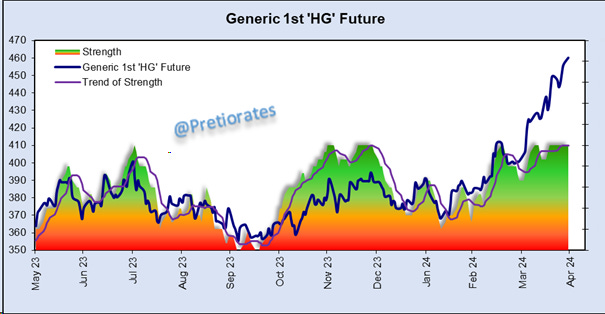
...and can also be seen in comparison to the index of all base metals...
Who is responsible for this? Let's take a look at the charts from a colleague this time: China is buying far more Copper than usual at this time of year... For what? The economy is not doing so well...
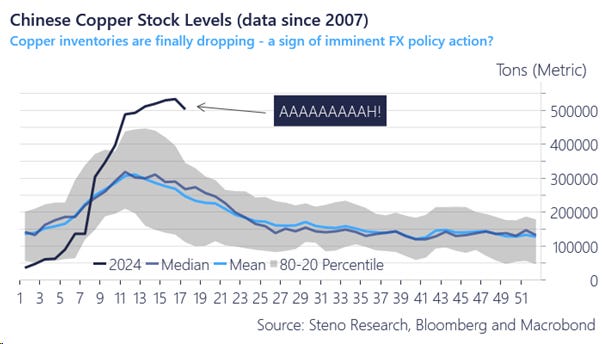
Source: Andreas Steno Larsen
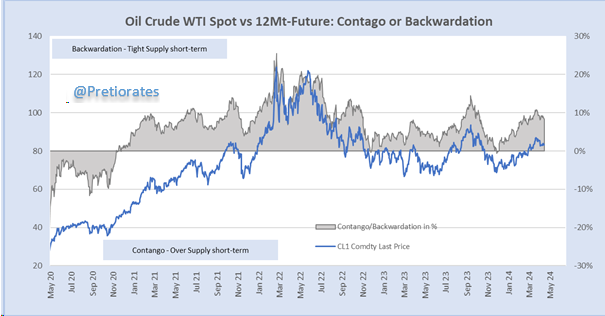
The Oil price is moving in line with inflation expectations...
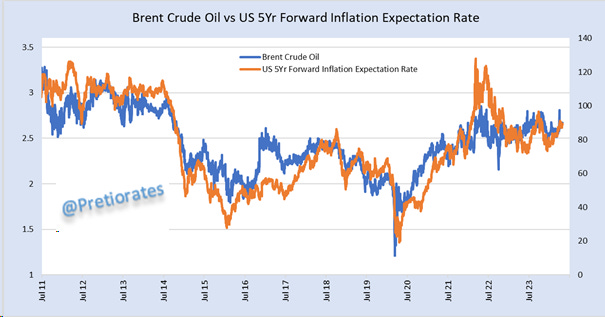
By contrast, futures continue to show backwardation, i.e. a tightening of short-term supplies. This means that the Oil price is unlikely to fall for the time being...
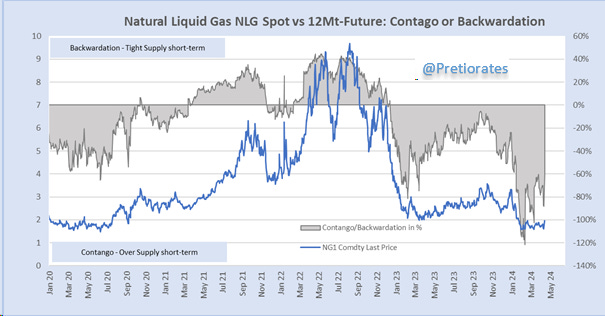
The opposite can be seen in the LNG market: the large oversupply (contango) continues and gives a possible recovery of the Gas price hardly a chance...
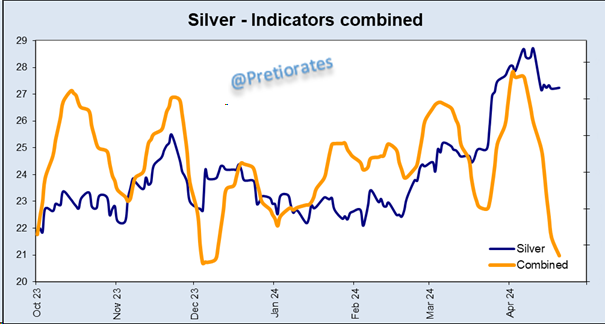
The consolidation in Silver could soon come to an end and the Silver bugs could become more active again...
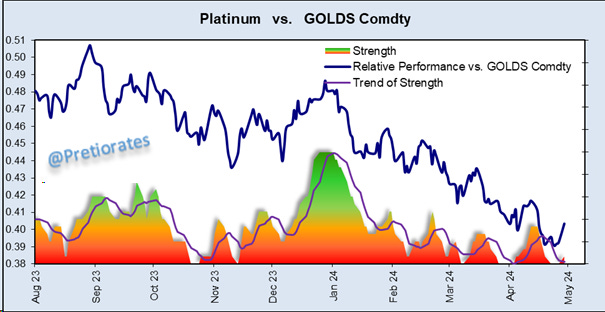
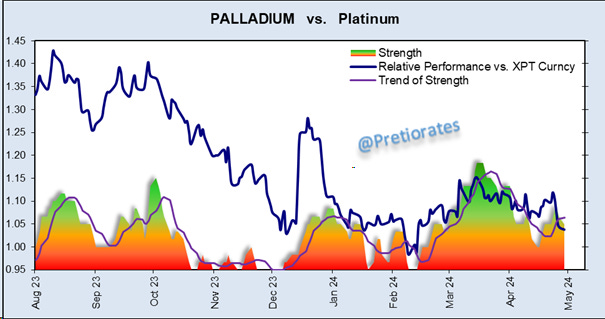
We continue to follow the platinum and Palladium market closely. The disappointing EV sales should give a boost to fossil-fueled vehicles again - and thus to catalysts and demand for the two metals... There is also potential to catch up with Gold and Silver... The Platinum market is not yet showing any strength of its own...
Nor is Palladium: the upward trend in March only had a short life...
That’s it for today!
Remember, we are not making any recommendations for investments, we are just giving you ideas for your own analysis and decisions! Do your own due diligence!
We wish you successful investments!
More By This Author:
Chapter 2 Should Start With Precious MetalsPrecious Metals Market – Chapter 2 Is Starting
Strange Movements Continue
Comments
Log in or sign up to join the conversation.