


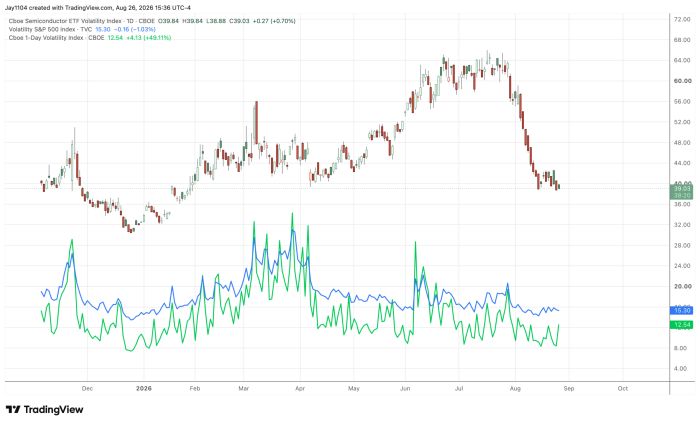
Stocks were subdued on Wednesday as markets awaited Nvidia’s (NVDA) earnings. If you looked at implied volatility metrics, there was a sense of calm out there—not a care in the world. The VIX was basically flat near 15, while the VIX 1-Day didn’t even break 13. Even the semiconductor VIX hardly moved.
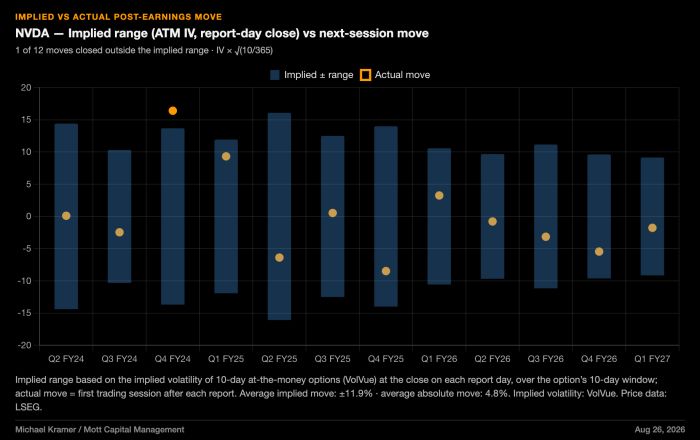
The expected trading range for Nvidia following results was only about 5.5%, and historically, at least over the past few quarters, Nvidia’s next-day moves have been fairly small and generally stayed within the implied range. So betting on big moves hasn’t paid off, which is probably why there was little to no reason for implied volatility at the index level to rise ahead of results.
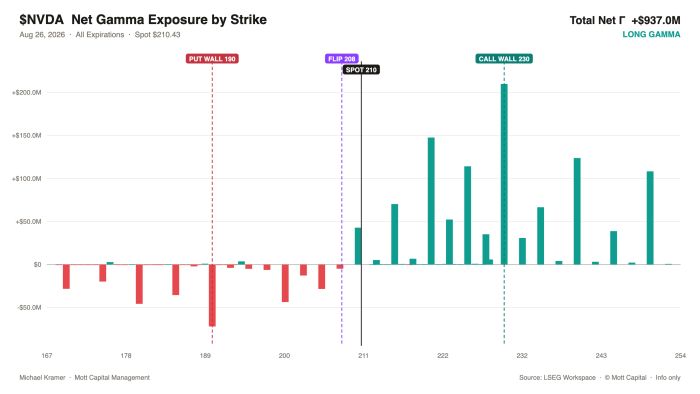
To no one’s surprise, the company reported better-than-expected results, beating analysts’ expectations. However, not much has changed for the stock since my original post on Saturday. Gamma positioning has hardly changed this week; the main difference is that the stock now finds itself below the gamma flip level. The question becomes which way hedging flows go and whether they become directional.
What we have tended to see in the past is the bigger move coming over the two days following the results. If the stock continues to drift lower overnight, then I think the case for reaching the put wall at $190 gains momentum. Given the current setup, I think a push back to $220 becomes increasingly difficult.
But one thing I do know is that markets are hard to predict.
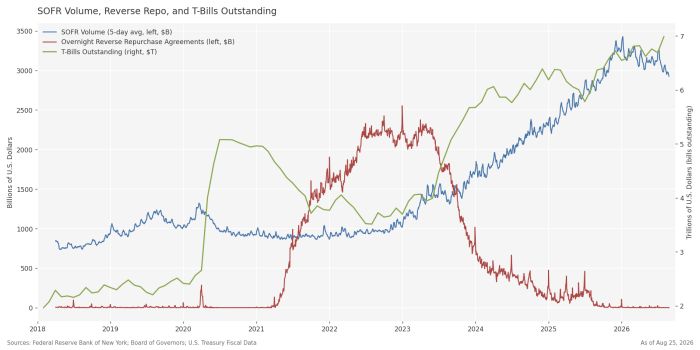
More recently, I’ve noticed that SOFR volumes have been declining rather notably. It’s hard for me to say why. Some on social media have pointed to the unwinding of the Treasury basis trade, but I honestly don’t know the reason. This is a corner of the market I really have little ability to see into.
What stands out to me, though, is that daily SOFR volumes peaked in December 2025, which is no surprise given year-end positioning, while T-bill issuance has continued to rise. I guess what interests me is whether the market has finally reached a point where T-bill issuance is draining liquidity that would otherwise have gone into other types of trades.
The reverse repo facility has been drained to essentially zero, and the buffer of excess liquidity that sat there and helped absorb the last two years of bill supply is basically gone. All new bill issuance now has to be paid for with cash pulled from elsewhere in the system. Falling SOFR volumes relative to record issuance may be the first place where that pressure is showing up. Time will only tell.
Finally, PCE came in hot on the headline reading, while the second-quarter GDP revisions only made things worse, in my view. Real GDP remained at 1.5%, but the deflator was revised higher to 6.4% from 6.3%.
When you look at the year-over-year changes, nominal GDP is rising by nearly 6.6%, with the PCE deflator up 4.4% and real growth of only around 2.1% to 2.2%.
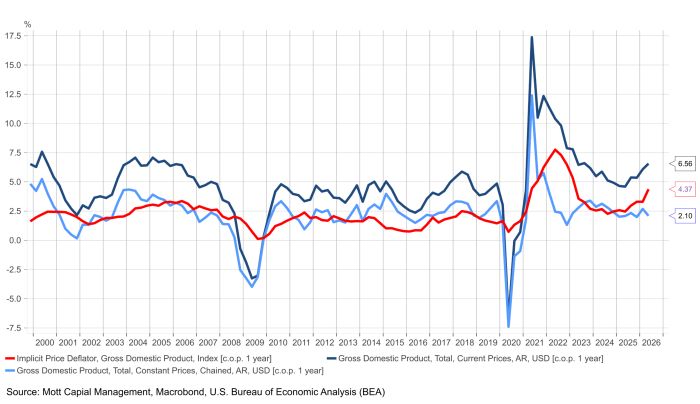
So why are long-end rates rising? Do I really have to explain it?
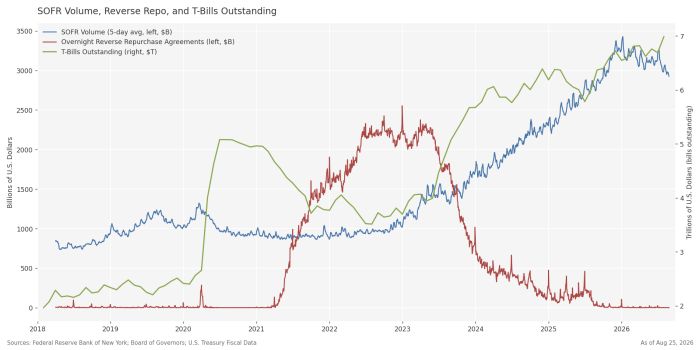
More recently, I’ve noticed that SOFR volumes have been declining rather notably. It’s hard for me to say why. Some on social media have pointed to the unwinding of the Treasury basis trade, but I honestly don’t know the reason. This is a corner of the market I really have little ability to see into.
What stands out to me, though, is that daily SOFR volumes peaked in December 2025, which is no surprise given year-end positioning, while T-bill issuance has continued to rise. I guess what interests me is whether the market has finally reached a point where T-bill issuance is draining liquidity that would otherwise have gone into other types of trades.
The reverse repo facility has been drained to essentially zero, and the buffer of excess liquidity that sat there and helped absorb the last two years of bill supply is basically gone. All new bill issuance now has to be paid for with cash pulled from elsewhere in the system. Falling SOFR volumes relative to record issuance may be the first place where that pressure is showing up. Time will only tell.
Finally, PCE came in hot on the headline reading, while the second-quarter GDP revisions only made things worse, in my view. Real GDP remained at 1.5%, but the deflator was revised higher to 6.4% from 6.3%.
When you look at the year-over-year changes, nominal GDP is rising by nearly 6.6%, with the PCE deflator up 4.4% and real growth of only around 2.1% to 2.2%.
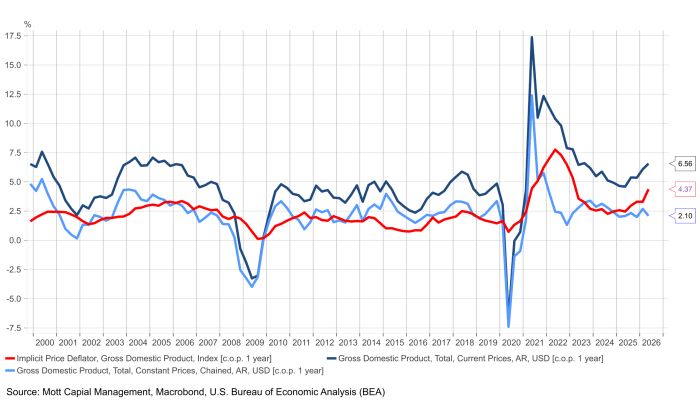
So why are long-end rates rising? Do I really have to explain it?


Comments
Log in or sign up to join the conversation.