


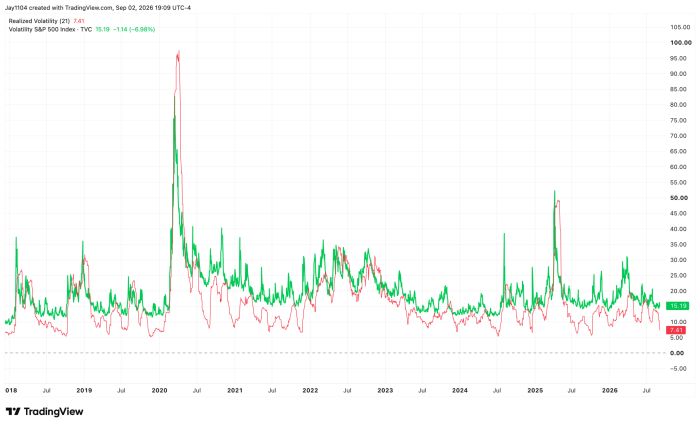
Stocks finished the day higher, with the S&P 500 (SPY) rising by 46 bps, while rates stalled along with oil. Implied volatility measures were also lower overall. Meanwhile, realized volatility has sunk, with 21-day realized volatility falling to 7.4%, which equates to a daily move of about 46 bps. So, if the index starts moving by more than 46 bps per day, realized volatility will expand, and if daily moves contract further, realized volatility will continue to fall. It can still go lower, but unless we start trading in even tighter daily ranges, that’s going to be difficult.
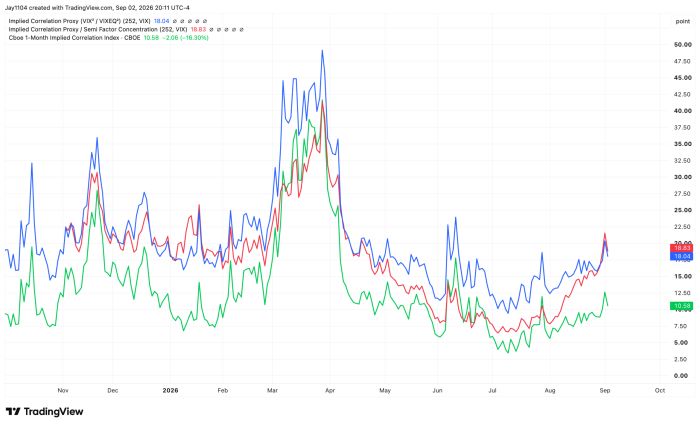
Implied correlation also fell today, with Cboe’s 1-month index down to 10.6 and my own proxies lower. But the bigger picture is that implied correlation has been grinding higher since early July, even as realized volatility kept falling and single-stock volatility continued to drop. It is also worth remembering that implied correlations have historically remained very low. Index vol has been holding up better than the stocks beneath it for the past 2 months.
Semiconductor implied volatility also fell on the day, even with Broadcom (AVGO) reporting results tonight, which I believe is due to a general lack of interest in the group.
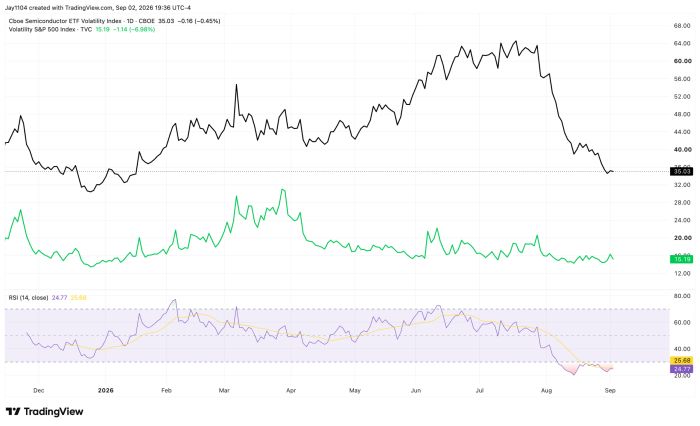
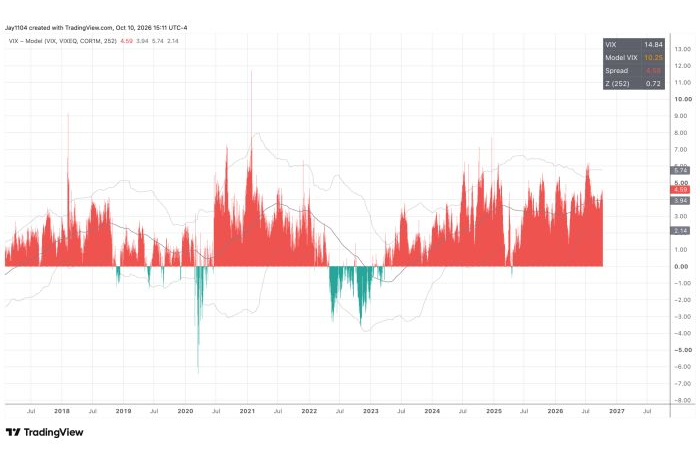
That’s what is kind of odd here: the VIX has essentially stalled out since early August in a tight range, while realized volatility, single-stock volatility, and even semiconductor volatility have continued to fall. It suggests a couple of possibilities: either the VIX is going to fall to catch up with the decline in volatility, or investors are beginning to pay up for index-level hedges, even though you wouldn’t necessarily know it just by looking at the VIX.
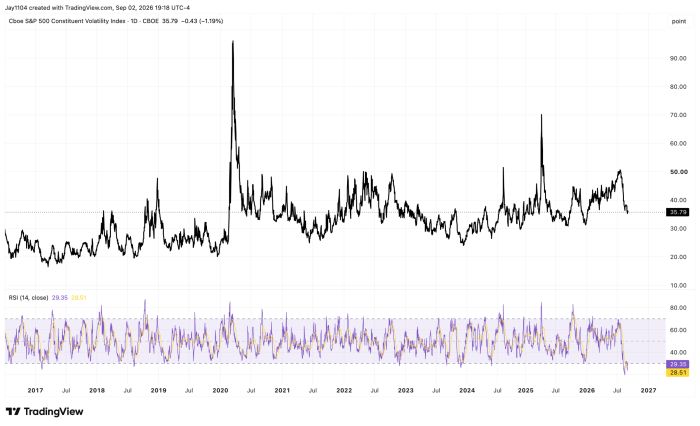
It just seems like a recipe for something to unwind here, and right now we are just looking for the trigger event. Perhaps it doesn’t even need a trigger; perhaps now that Broadcom’s results are finished, the rest of that implied volatility will bleed out of the VIXEQ, and we’ll see single-stock volatility fall in the days to come.


Comments
Log in or sign up to join the conversation.