
SPX Monitoring purposes; Long SPX on 10/31/25 at 6840.20.
Our gain 1/1/24 to 12/31/24 = 29.28%; SPX gain 23.67%
Our Gain 1/1/23 to 12/31/23 SPX= 28.12%; SPX gain 23.38%
Monitoring purposes GOLD: Long GDX at 75.76; 9/29/25
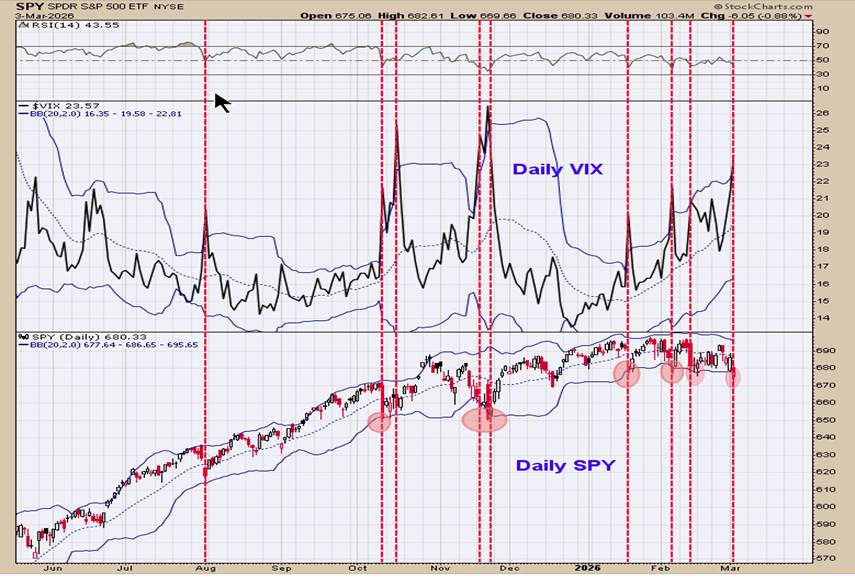
The SPY appears to be building a base for the next rally to start from. The top window is the daily VIX with its Bollinger band, and below that is the daily SPY with its Bollinger band. This chart goes back to June of last year. In all cases when the VIX reached it upper Bollinger band and the SPY reached its lower Bollinger band, the market was at or near a low (note on chart above). Still expect a rally in the SPY that may test the upper range near 700 or continue to rally to new higher highs.
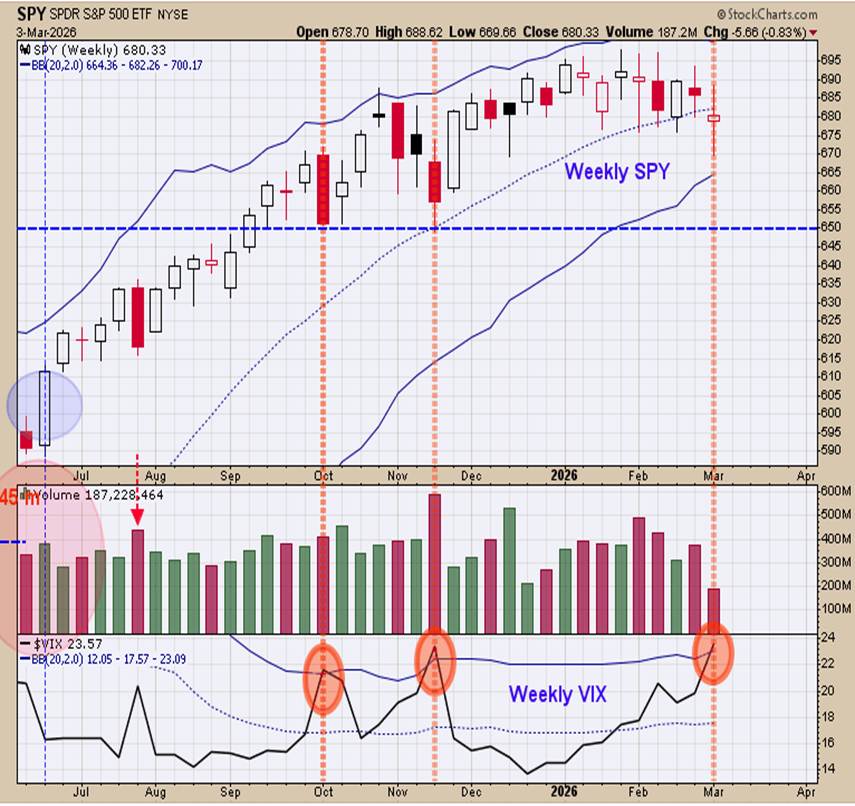
The bottom window is the weekly VIX with its Bollinger band, and the top window is the weekly SPY with its Bollinger band. This is the weekly timeframe and not the daily. We noted the times when the weekly VIX reached its upper Bollinger; the last two marked lows. This week is not over, but the weekly Bollinger band is above its upper Bollinger, suggesting the weekly SPY is near a price low. If the SPY closes near its current level, then most likely the VIX will stay near current levels and above its upper Bollinger band, suggesting this area is a low for the SPY. If the SPY rallies from here than the VIX will fall below its upper Bollinger band, and little information will be deduced. With daily and weekly VIX reaching its Bollinger band does suggests this price level on the SPY has support.
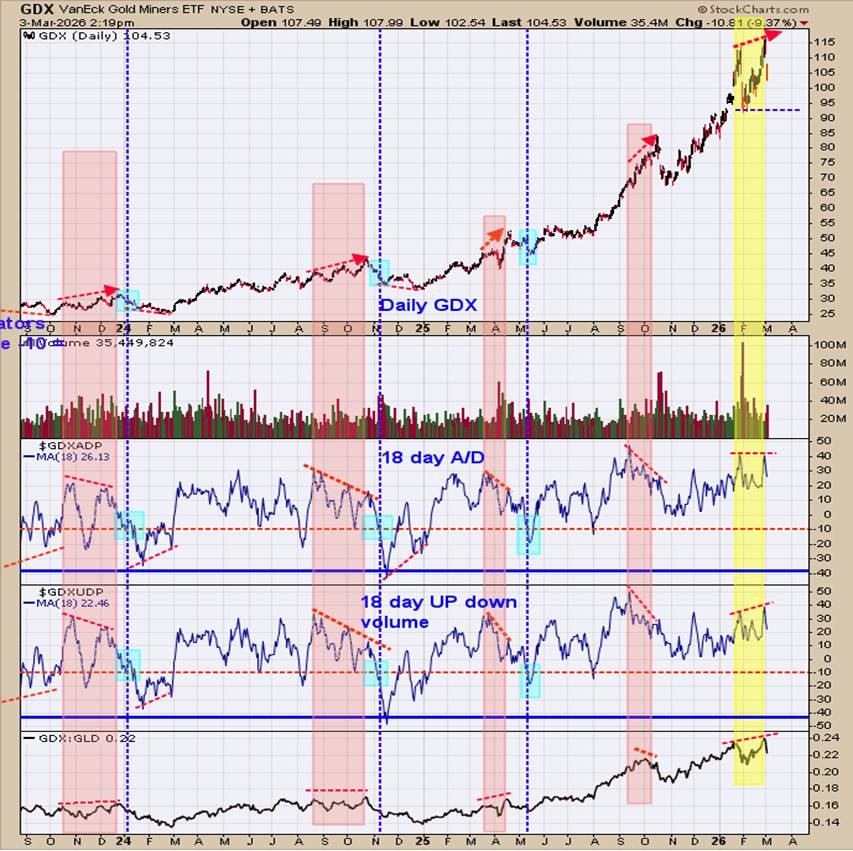
A major gold stock rally has begun, and according to cycle analysis, could last into 2036. There will be consolidation along the way, and we are on alert to see if one is in possible development. The bottom window is the GDX/GLD ratio, next higher window is the 18 day average of the up-down volume for GDX and next higher window is the advance/decline for GDX, and top window is the GDX. We shaded in pink the times when at least two of the three indicators showed a divergence, suggesting a consolidation in GDX, which worked well. Currently, we have no divergences in the three indicators (shaded in yellow) as all three indicators made higher highs while GDX made a higher high. Long GDX on 9/29/25 at 75.76.

Comments
Log in or sign up to join the conversation.