
SPX Monitoring purposes; Long SPX on 4/8/26 at 6782.81.
Our gain 1/1/24 to 12/31/24 = 29.28%; SPX gain 23.67%
Our Gain 1/1/23 to 12/31/23 SPX= 28.12%; SPX gain 23.38%
Monitoring purposes GOLD: Long GDX at 75.76; 9/29/25
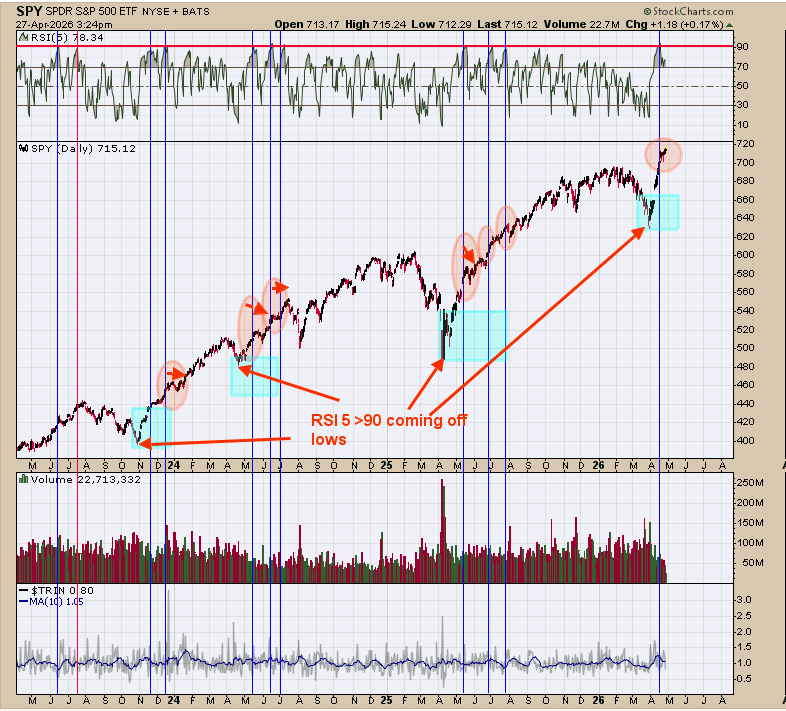
We have updated this chart from last week. Previous times coming off lows the 5 period RSI reaching +90 did so at least twice. So far, there has been just one +90 RSI; suggests at least another +90 RSI coming and that in turn would suggest more strength in SPY. Previous commentary still applies, “Above is a momentum indicator; top window is the 5 period RSI for the SPY. We note with blue lines the times when the RSI 5 reached above 90 (strong momentum for SPY). Notice that most 5 RSI > 90 reading are when the SPY is coming off a low (shaded in light green), and usually there is more than one RSI >90 coming off a low. There is one outlier noted with red line back in July 2023; other than that, an RSI 5 above 90 suggests more rally to come.”
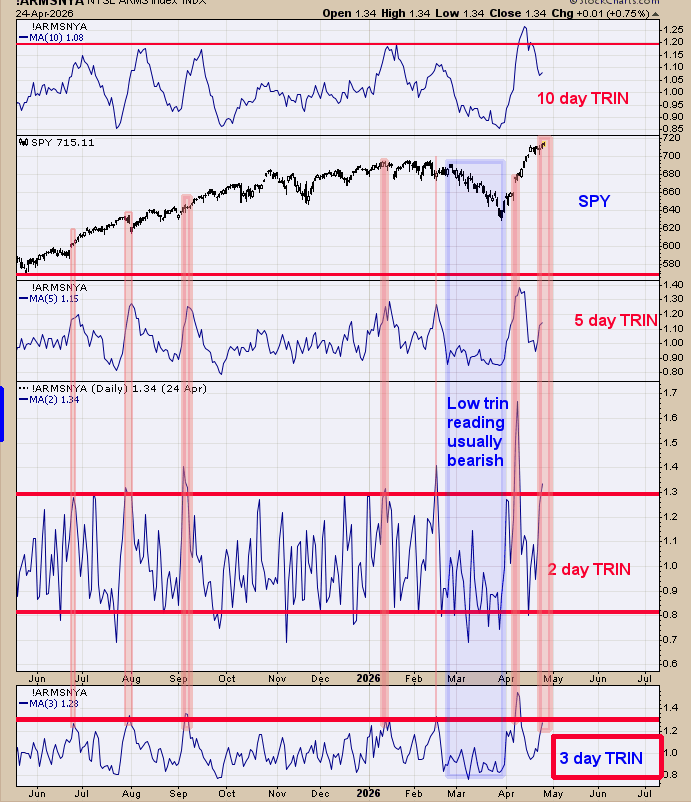
The bottom window is the 3 day average of the TRIN closes. We shaded in pink the times when the 3 day TRIN closed 1.30 and higher and then transposed that reading on the SPY chart. In most cases the 3 day TRIN above 1.30 puts energy in the market and pushes the market higher. We also noted the times in shaded blue when the 3 day TRIN was below one; these times the market struggled. Can see a consolidation short term (see page one) but with panic at current levels suggests downside is minimal.
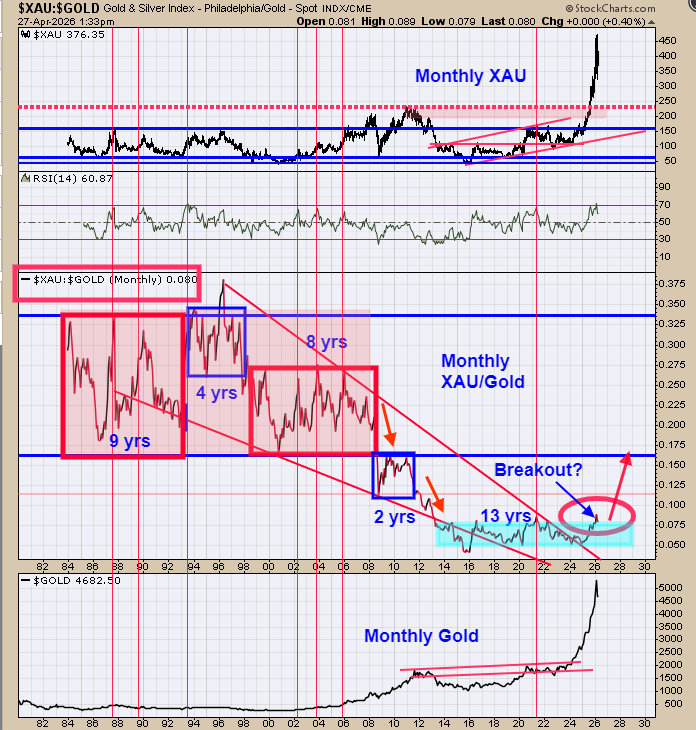
Above is a very large view of what may be developing in the gold market. The middle window is the monthly XAU/Gold ratio, which dates back to 1982. The bottom window is the monthly Gold chart and top window is the monthly XAU. Referring back to the monthly XAU/Gold ratio, we boxed out the times when the monthly XAU/Gold ratio was in a trading range. These previous trading ranges last from 2 years to as long as 9 years. The current trading range (shaded in green) has run 13 years; an unusually long time compared to previous trading range and is due for a breakout. Notice that is the currently monthly XAU/Gold ratio is setting above its previous high; if it holds here or moves higher in the coming weeks than most likely a breakout is at hand. So what does it mean if this ratio breaks out of the 13 year trading range? It mean that the XAU/Gold ratio would move higher to the next upside resistance near .16 (current reading is .08). If gold stays at current levels and the ratio go to .16 than XAU (GDX) would double from current levels. We have been saying in our reports that GDX is due for a consolidation that could last several months and we still stand by that statement. We are dealing with monthly charts and a few sideways months on a 13 year XAU/Gold trading range will well worth the wait for a major breakout. Long GDX 9/29/25 at 75.76.

Comments
Log in or sign up to join the conversation.