
8:30 am
(Click on image to enlarge)

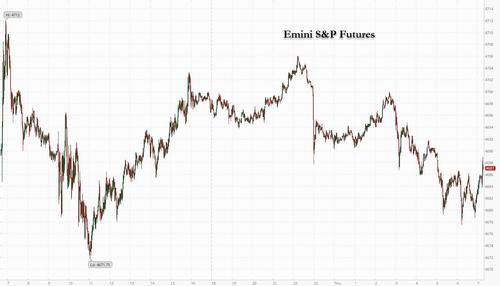
SPX futures are in decline, approaching the aggressive sell level at 4675.00 (sound familiar?). Confirmation may come at the Short-term and mid-Cycle supports at 4642.56. Apparently, a 3-day short-covering rally does not show on the Cycles Model for the SPX, nor does it register on the VIX Model. The Cycles appear to be telling us that the decline may resume.
ZeroHedge reports, ” After three days of torrid gains, US futures and European markets fell as concerns about economic risks from restrictions to control the new variant outweighed optimism about the efficacy of vaccines after a study from Japan found that the omicron variant is 4.2 times more transmissible (as largely expected) in its early stage than delta. Both S&P 500 and Nasdaq futures dropped around -0.4% as traders awaited earnings from Broadcom, Oracle and Costco after the market close and tomorrow’s key CPI print, while European equities drifted lower in quiet trade with little fresh news flow to drive price action.
(Click on image to enlarge)
Uncertainty about monetary policy could keep stocks “significantly volatile,” according to Pierre Veyret, a technical analyst at ActivTrades in London. “Investors are likely to remain cautious and keep on monitoring the macro outlook, especially today’s U.S. initial jobless claims, in order to gather more clues on what and when could be the Fed’s next move,” said Veyret.”
(Click on image to enlarge)

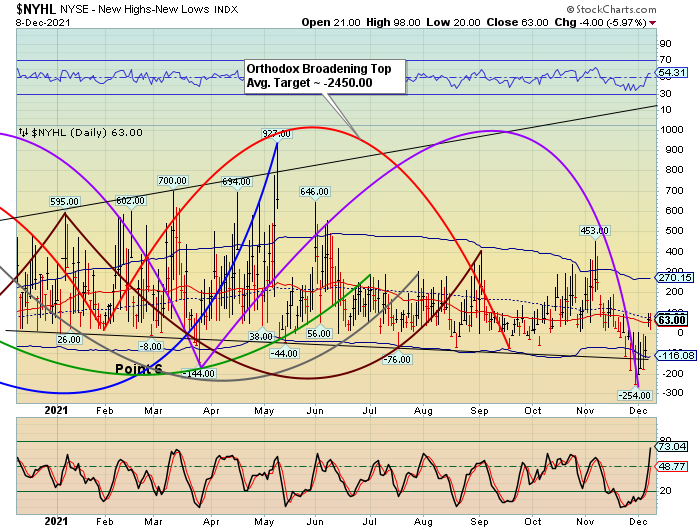
VIX futures rose to an overnight high of 20.81, thus far. The Cycles Model calls for the next interval to be in the last week of December. Should the Wave structure be correct, Minor Wave 3 may be 3-5 times the size of Wave 1! We’ll discuss actual targets as this rally unfolds. VIX Guy may have made the same error that I had, referring to the lower 5-month” Head & Shoulders” at 28.79. It faked both of us out. However, the Cycles Model pointed to Friday’s high at 35.32, since necklines usually fall at the top or bottom of Wave 1, giving us an 11-month formation, which is ignored by many technicians.
ZeroHedge remarks, “VIX guy continues nailing it".
Nasdaq futs unch, SPX futs unch. What is the vol of that? As a reminder, this is what our favorite VIX (inverse) indicator told us a week ago:
“His main idea was to buy VIX here. Needless to say, we are starting to sell volatility here. One way to play it is via put spreads in VIX. After all, volatility is mean-reverting and our VIX guy has continued holding the perfect 100% inverse track record. Will he nail it again?”
Here we are with the VIX having crashed and it continues moving lower today. Dealers are in long gamma, and unless this moves asap, they will add to vol selling as well as funds getting involved in overwriting stuff post the squeeze move. Chart showing the VIX as well as the 2/8 months spread imploding.
(Click on image to enlarge)
The NYSE Hi-Lo closed between the 50-day Moving Average at 54.36 and mid-Cycle resistance at 77.03. Monday would have given a Hi-Lo buy signal, having crossed above the Cycle Bottom at -116.00, but I had looked at the absolute below zero reading and failed to point that out. My error. Compounding this, neither the SPX nor the VIX Models gave a buy signal.
Comments
Log in or sign up to join the conversation.