


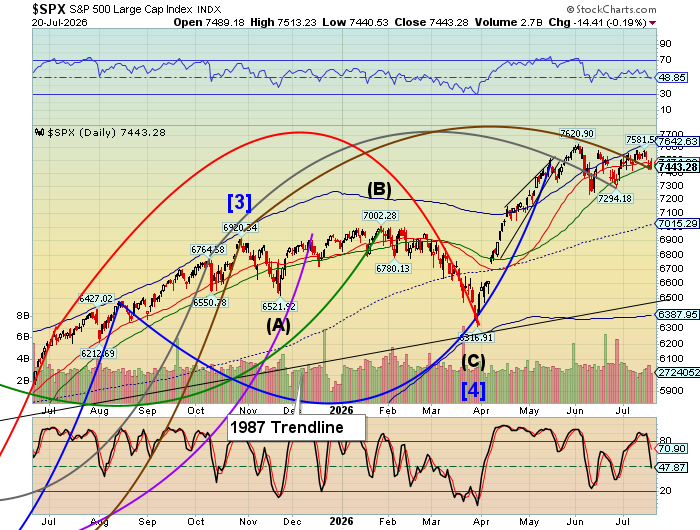
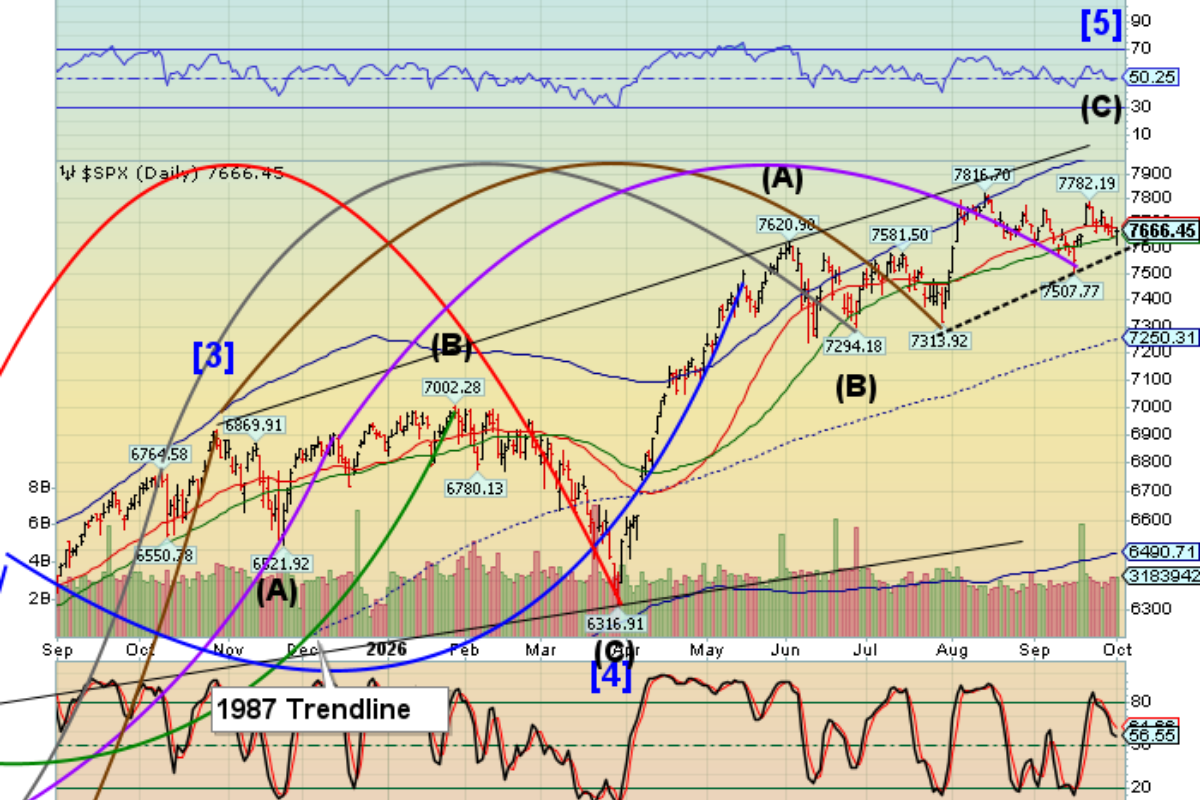
SPX futures rose above the 52-day Moving Average at 7460.00 to 7490.40 this morning, influenced by bounces in the Japanese and Korean markets. This action may constitute a double reversal from a high to a low in 2 days within the Master Cycle turn phase. Should it follow through to the upside, it may allow the SPX to reach 7700.00 by early September.
ZeroHedge reports, “US stock futures are higher led by Tech after a strong bounce in chip stocks in Japan (memory stock Kioxia traded limit up after trading limit down on Friday and Monday was a holiday) and Korea, as evidence mounts that Momentum / Semis pullback have bottomed, with supportive price action elsewhere in Asia and Europe, though the JPM EU Trading Desk is not yet seeing follow-through buying in Semis.”
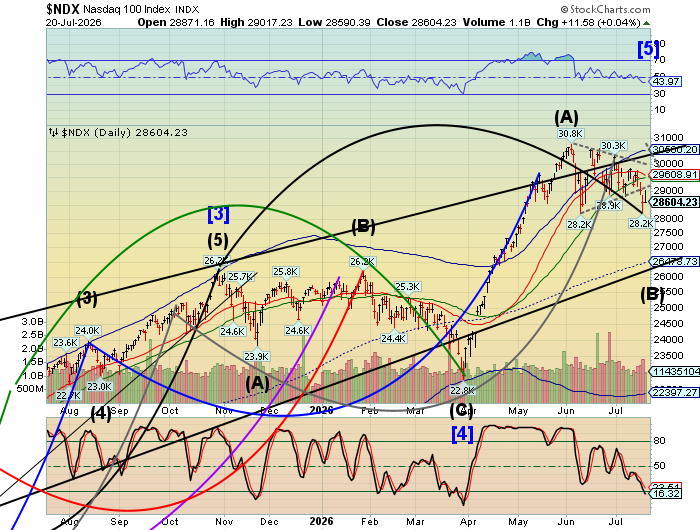
US Tech futures reached 29026.70 thus far this morning. At 29200.00 the NDX may re-enter the Triangle formation with the 52-day Moving Average at 29501.00. Above that, a clear buy signal awaits. The Cycles Model infers a renewed uptrend until early September. A rally to 36000.00 is possible.
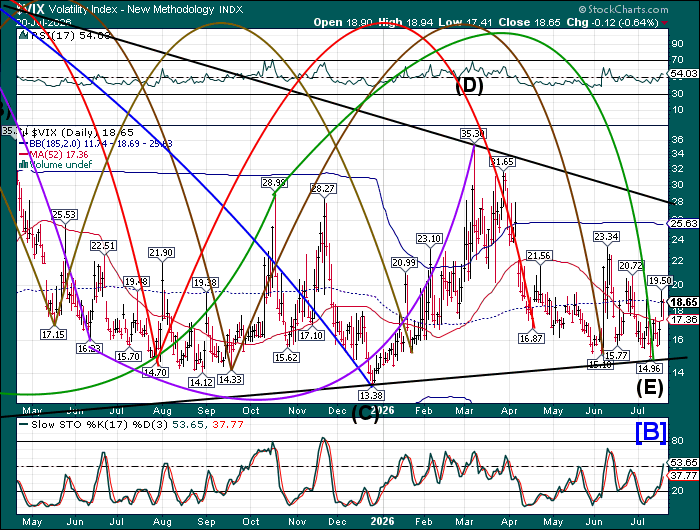
The premarket VIX eclined to test the 52-day Moving Average at 17.36. A failure at the mid-Cycle resistance may compel the VIX to decline again, beneath the lower Triangle trendline. While the VIX expected seasonal upswing approaches in August, it may do just the opposite. Individual stocks have become more volatile, but collectivly VIX remains calm. The Cycles Model suggests a new low in September.
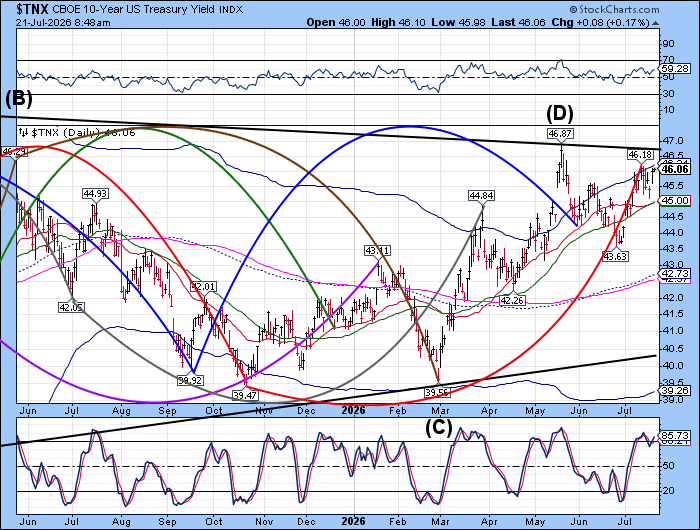
The US 10-year Bond Yield rose to 46.10 this morning, testing the Cycle Top resistance at 46.21. It may begin to lose momentum as resistance may prevent a further probe higher. The Cycles Model anticipates falling yields through the month of August as bonds capture a flood of liquidity originating in the overseas markets.
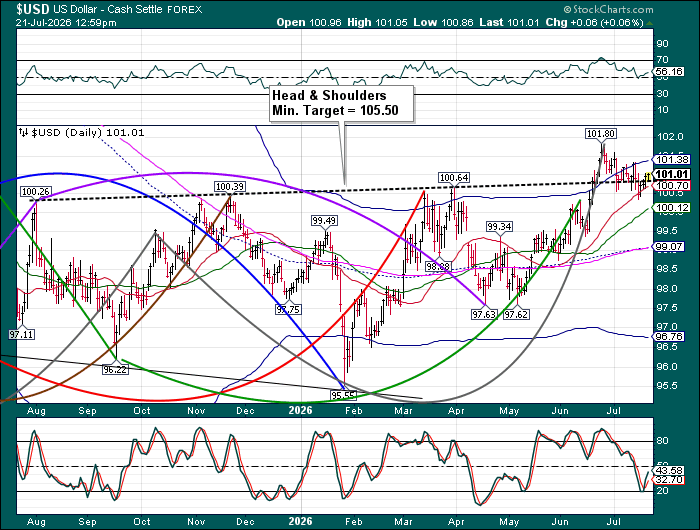
The US Dollar has risen above the Heaad & Shoulders neckline at 100.80 this morning. Should it go higher, the Cycle Top resistance at 101.38 may be overcome. Such a move anticipate the head & Shoulders target may be sought out by mid-August. The weekly chart suggests a higher target, at 108.00.
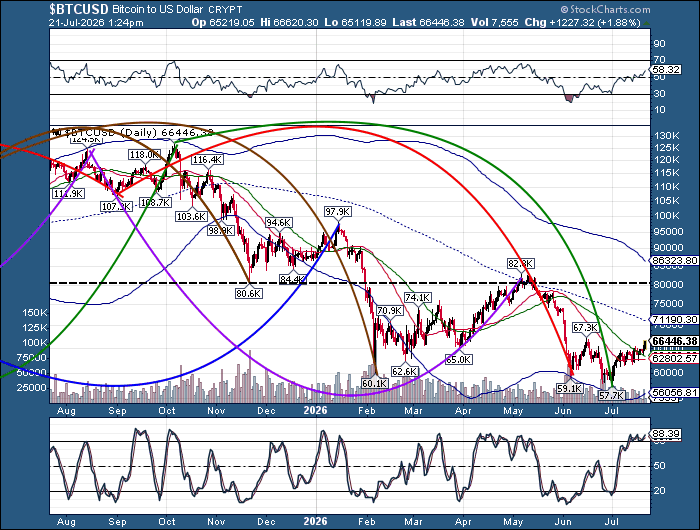
Bitcoin surged higher, finally showing trending strength as it emerges above the 52-day Moving average at 63457.00. It is on a buy signal for the next couple of weeks as it is showered with liquidity. The mid-Cycle resistance at 71190.00 appears to be a likely target.
Comments
Log in or sign up to join the conversation.