
Learnings and conclusions from this week’s charts:
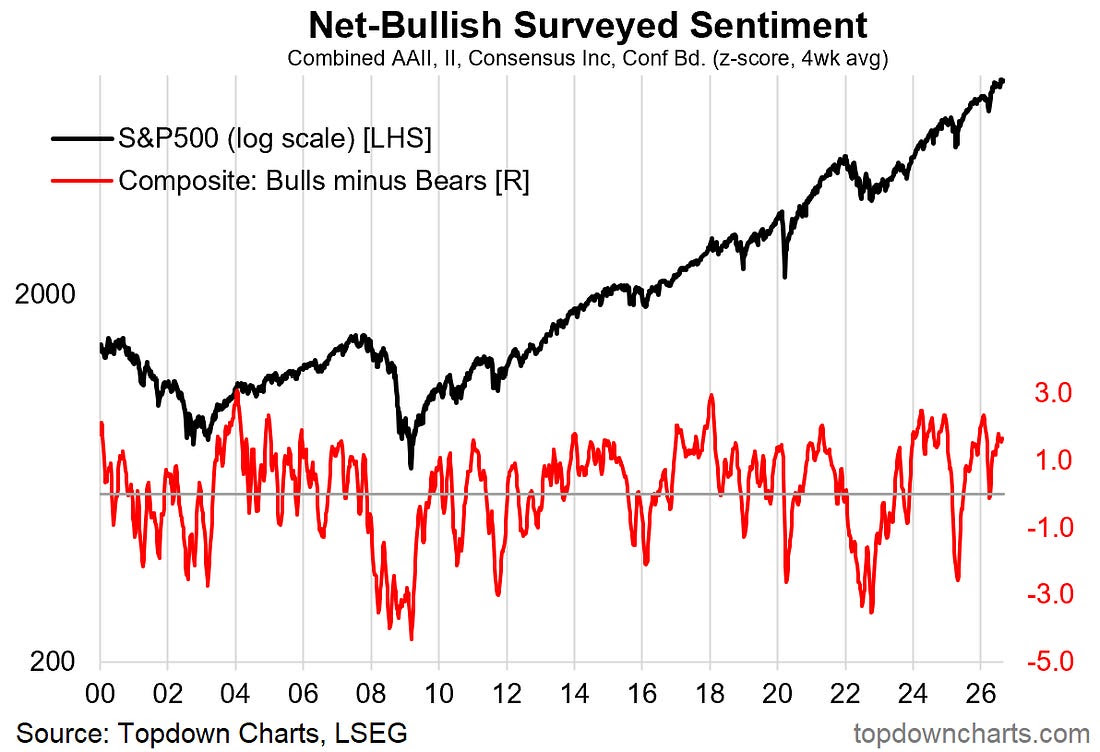
Overall, the market mood remains bullish and there are some bullish rotation trades underway. But the question is when does this consensus bullishness become complacency? There are a few flags of a potential volatility flare-up on the horizon, so it will pay to keep an open mind and an eye on the charts... 1. Surveyed Sentiment: the 4 surveys (AAII, Investors Intelligence, Consensus Inc, Conference Board) rolling 4-week average sentiment indicator shows the predominant mood remains distinctly bullish.
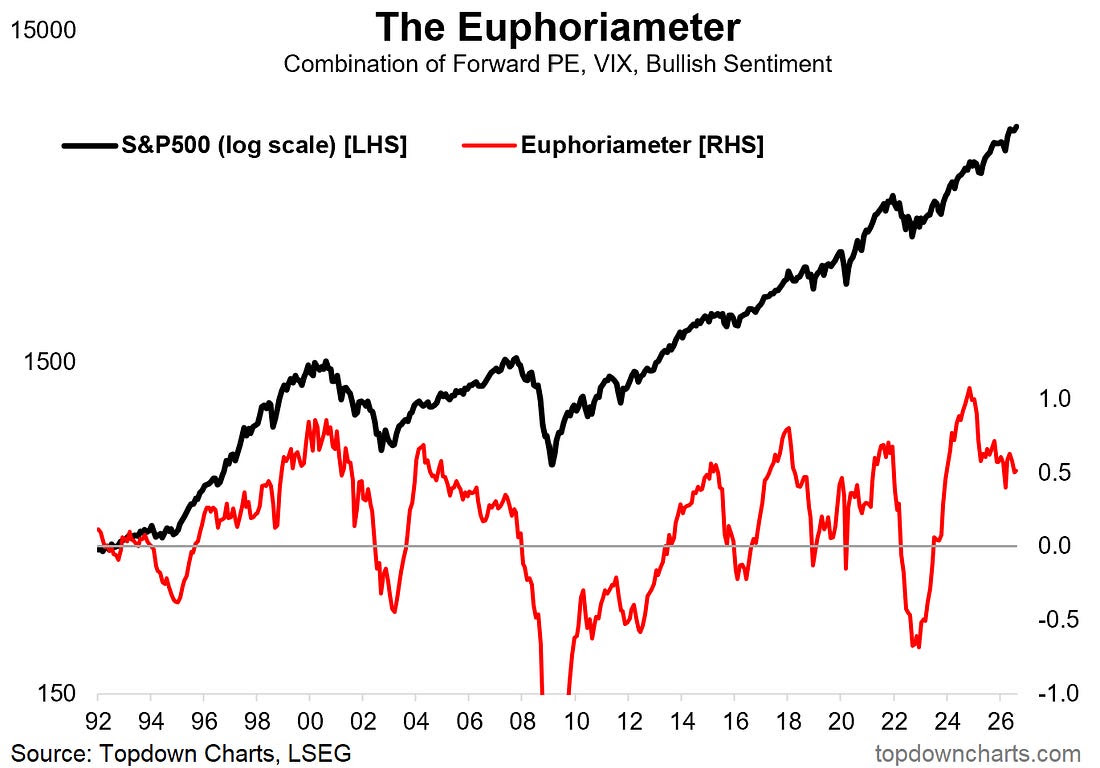
Source: Topdown Charts Professional 2. Combined Sentiment: the slower moving longer-cycle composite sentiment indicator (“Euphoriameter” — which combines smoothed readings of the VIX and bullish surveyed sentiment, along with forward PE ratios for the S&P500) shows the market remains in an extended euphoria phase. When everyone is bullish it means there are more minds that could be changed from bullish to bearish, given the right reason (and relatively few left to turn bullish).
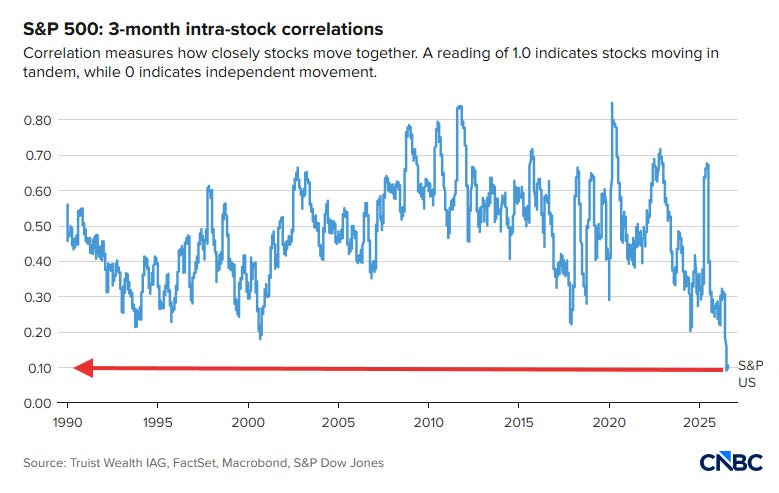
Source: Topdown Charts 3. Intra-Stock Correlations: thanks to increasing nuance around the impacts of AI, and the relative lack of broad-based macro influences on the stockmarket, stock correlations have dropped to record lows. This means price movements are being driven by individual stock fundamentals rather than big macro forces. Some would say that means macro is out and stock picking is in… …but I’d argue it’s a prelude to macro coming back, and if anything this indicator sure seems to be behaving like a contrarian signal.
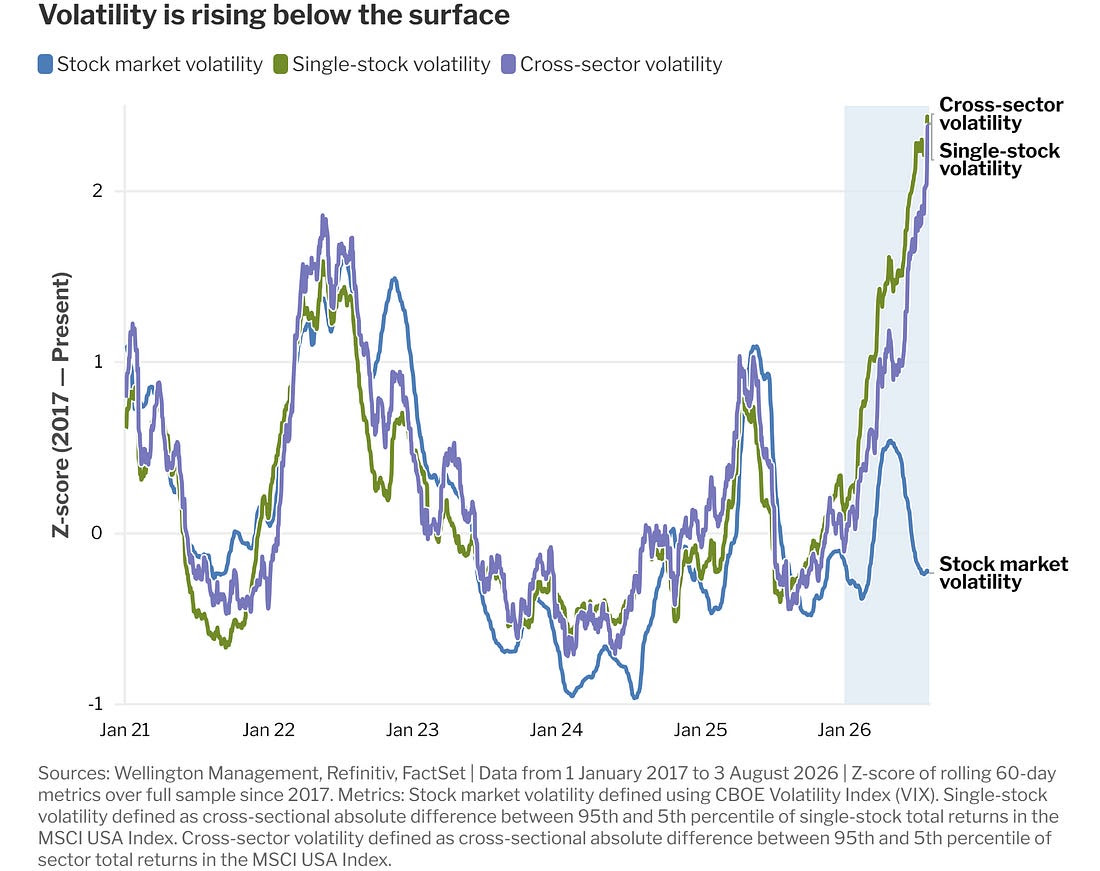
Source: @neilsethinew 4. Volatility Silently Rising: elsewhere in obscure indicators, and on a similar note, cross-sector and single-stock volatility is surging, while the index-level volatility (VIX) is slumbering — the last time it got like this was during the dot com bubble.
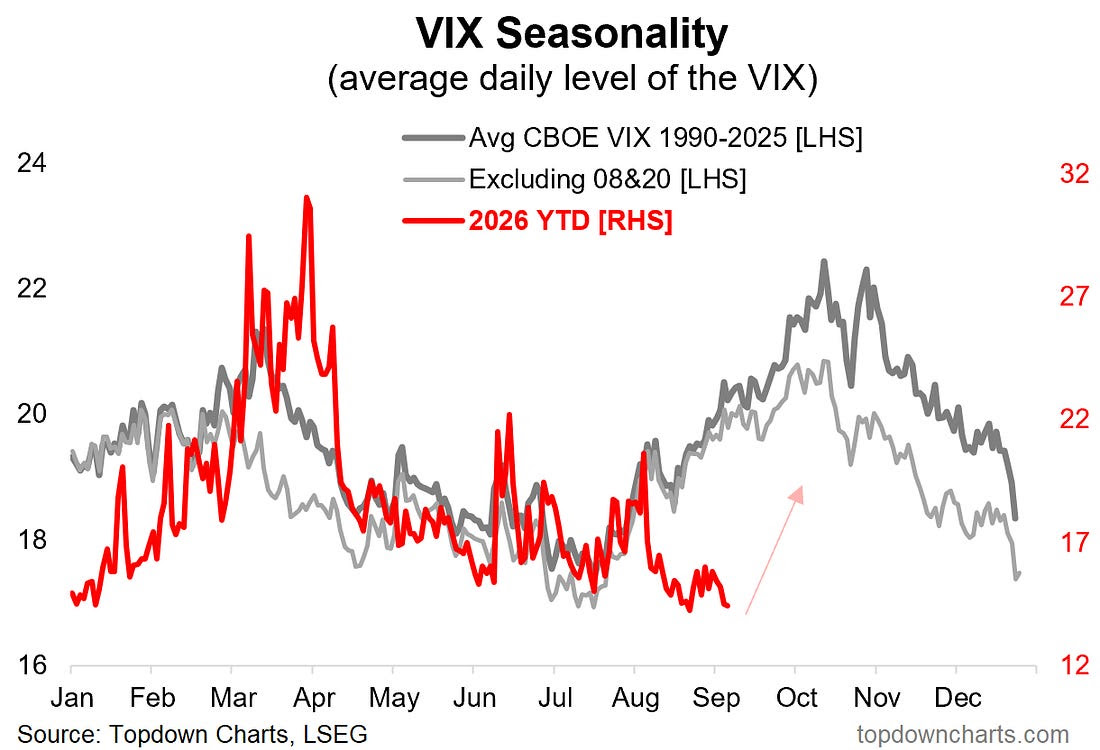
Source: Wellington Management via @MauiBoyMacro 5. Tis the Season for Shocks: seasonally speaking, now would be a very appropriate time to see volatility surge. As far as catalysts go there are plenty of candidates too (e.g. Fed is set to kick-off rate hikes, US mid-terms incoming, Iran conflict still smoldering, Russia looking to escalate in Ukraine/Europe, semis already peaked and still soft, AI enthusiasm waning, inflation/bond yields on the rise, weather/agri risks with El Nino, to name a few…).
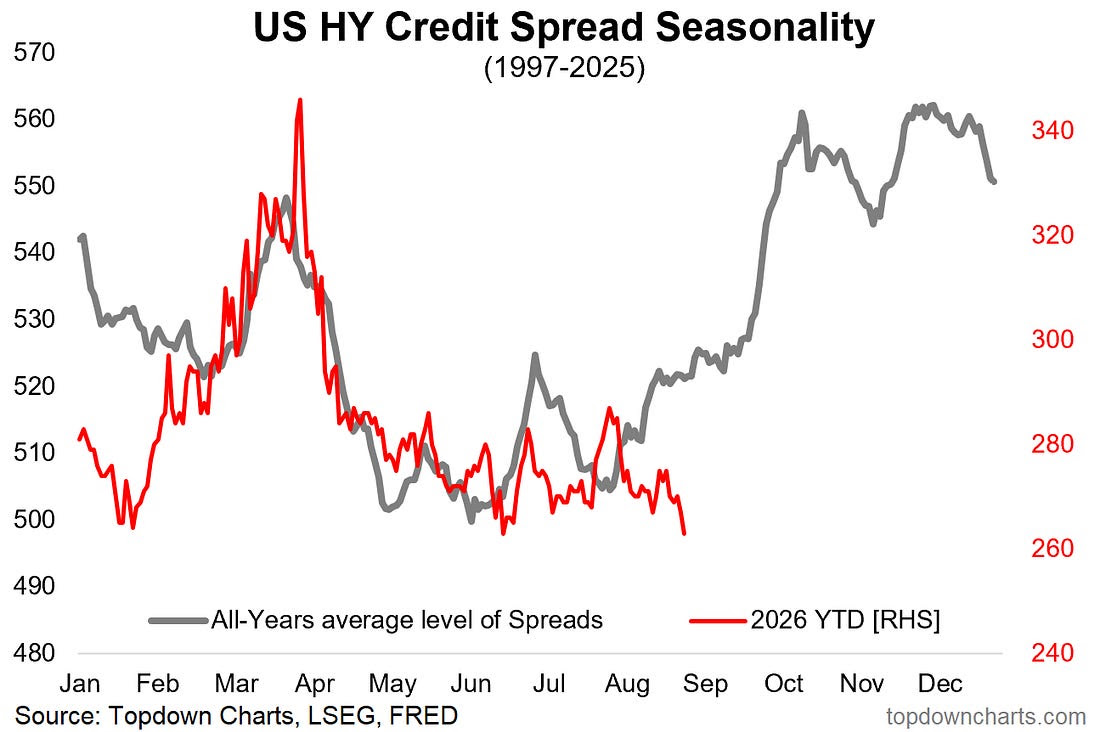
Source: Topdown Charts Research Services 6. And Credit Spreads: seasonally speaking, it’s also about that time of the year when credit spreads tend to widen. For credit spreads you usually need some kind of fundamental concern vs sentiment/technicals driven sell-offs in stocks for volatility. But also, a reminder that seasonality is not destiny, but rather a hint to stay alert to the possibilities (particularly when few people expect that possibility).
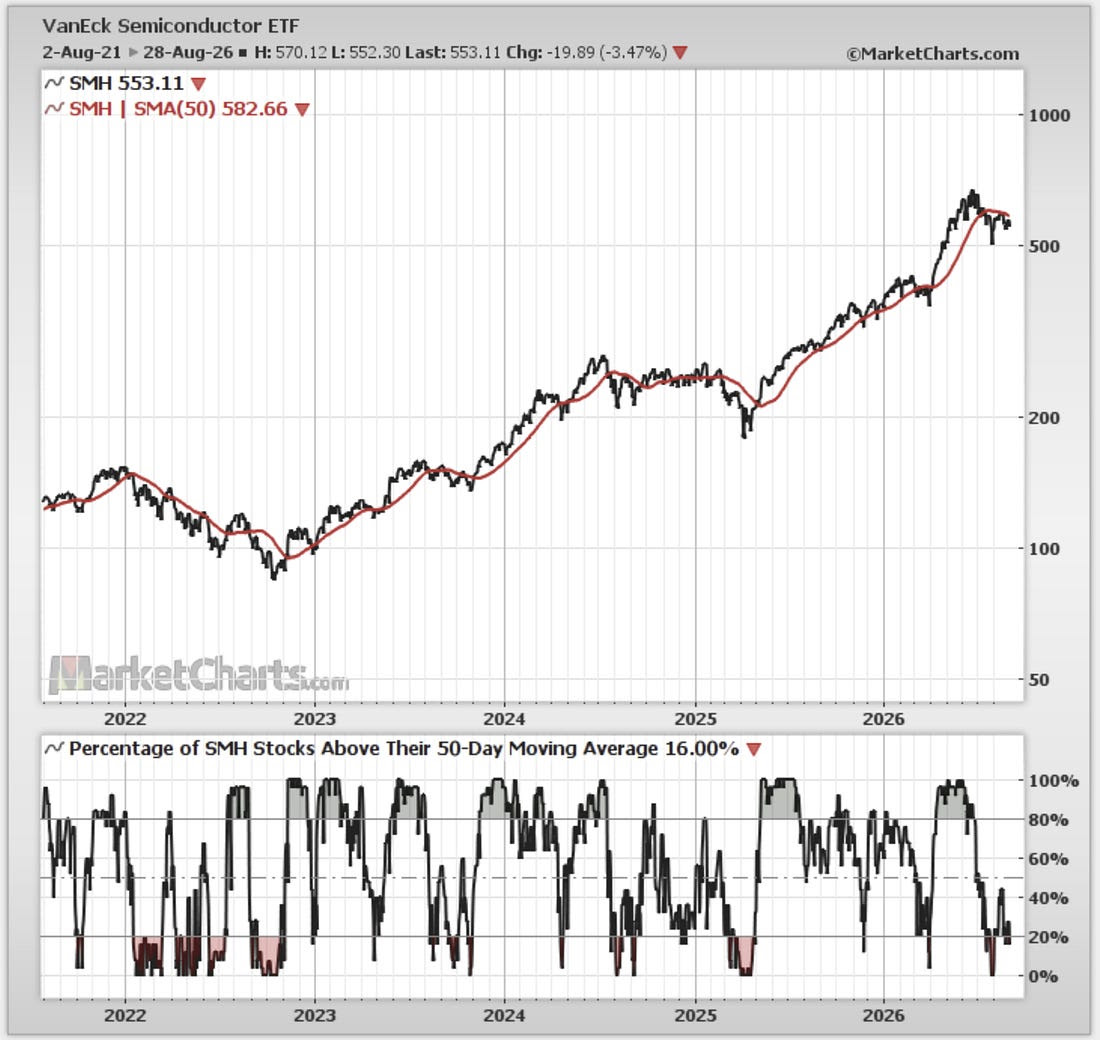
Source: Topdown Charts Professional 7. Semi Stall: as noted, semis are still stuck. US Semiconductor stocks peaked back in June and have been drifting lower since, with wide-spread weakness (poor market breadth). This is not necessarily outright bearish (e.g. as in 2022 when it was very bearish), but could just be a long-term intermission of range trading (e.g. as in 2024). Either way, it does NOT look bullish right now.
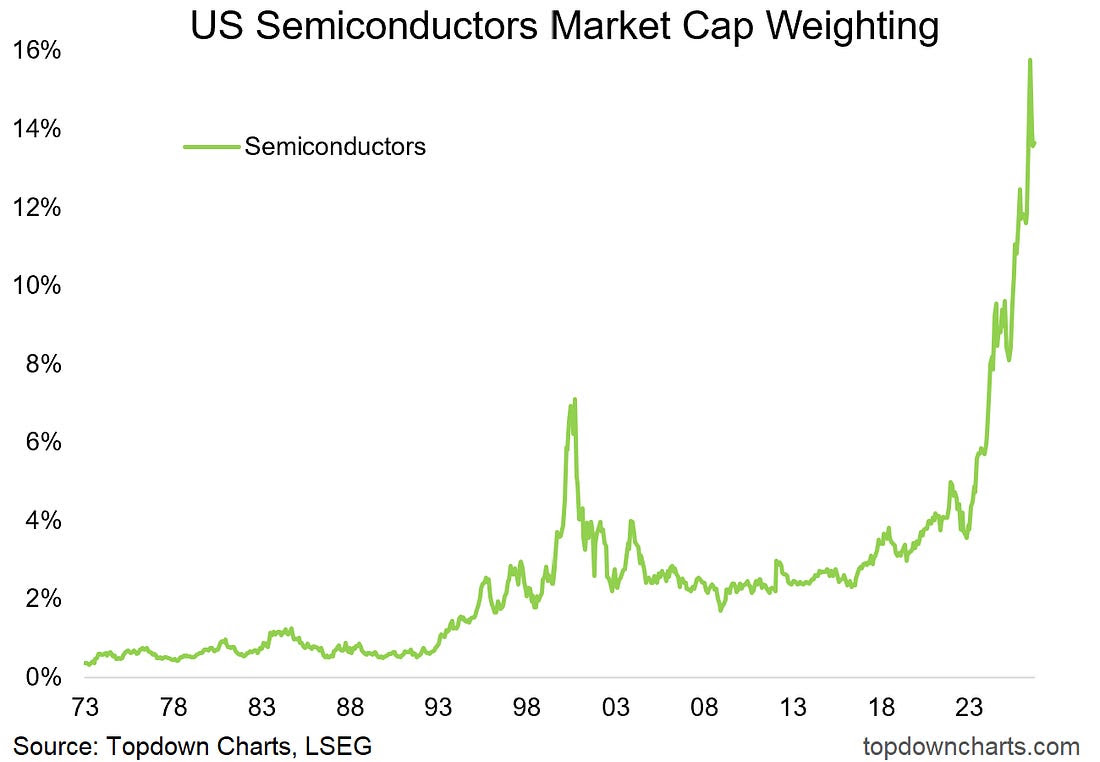
Source: MarketCharts 8. Boom and? and meanwhile there’s the looming specter that semis might be in a bubble, or at least in a boom phase that will eventually have a bust (and for that matter it is worth noting that even big long-term structural trends have cycles of boom and bust around them).
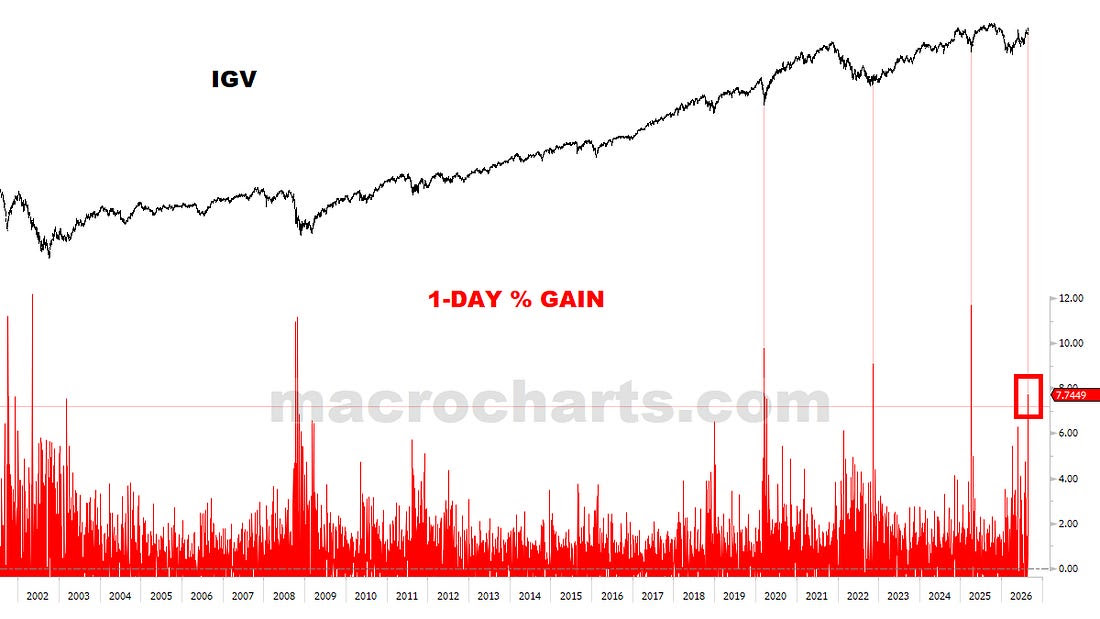
Source: Topdown Charts Professional 9. Software Surge: meanwhile software stocks are surging. Maybe it’s just month-end squaring of shorts, or general capitulation unwinding of long hardware vs short software trades as the relative performance of software vs hardware has sharply reversed. But either way, looking at history, sharp moves like these have been a positive omen in recent years.
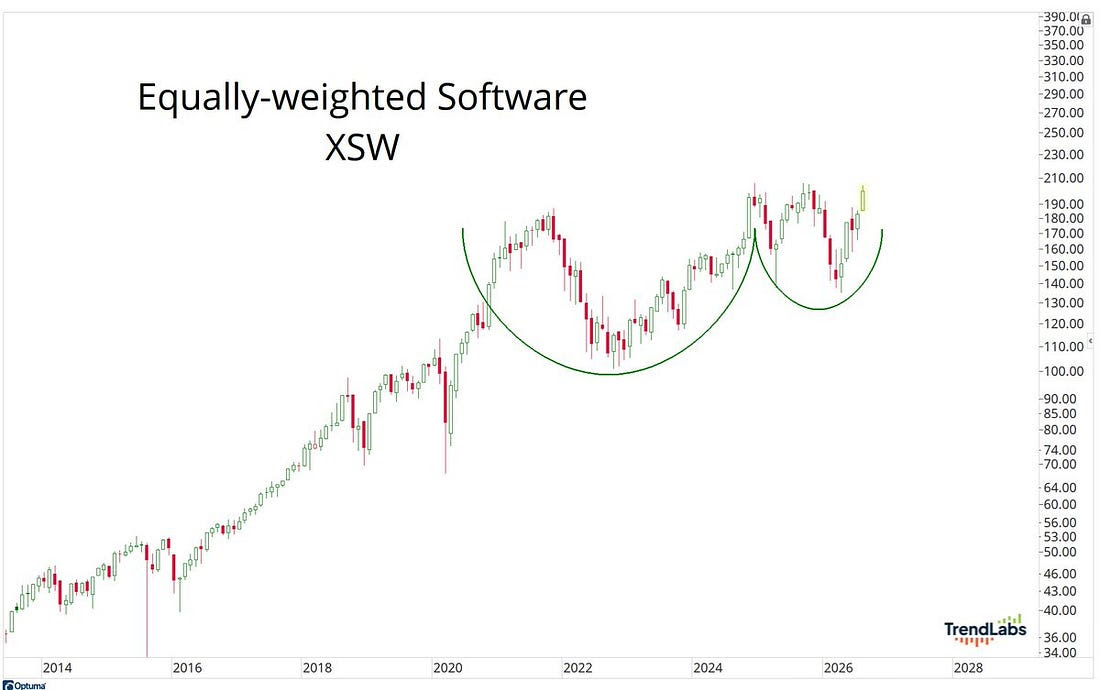
Source: @MacroCharts 10. Software Setting Up: looking at the monthly chart of software stocks, it looks very bullish — it does not look like a sector that is ““doomed”” by AI. If anything, breakout looks imminent.
Source: @JC_ParetsX |
S&P500 ChartStorm - August 30, 2026

This week: sentiment snippets, volatility and correlations, credit spreads, seasonal shocks, semi stocks, software, and bitcoin ...


Comments
Log in or sign up to join the conversation.