


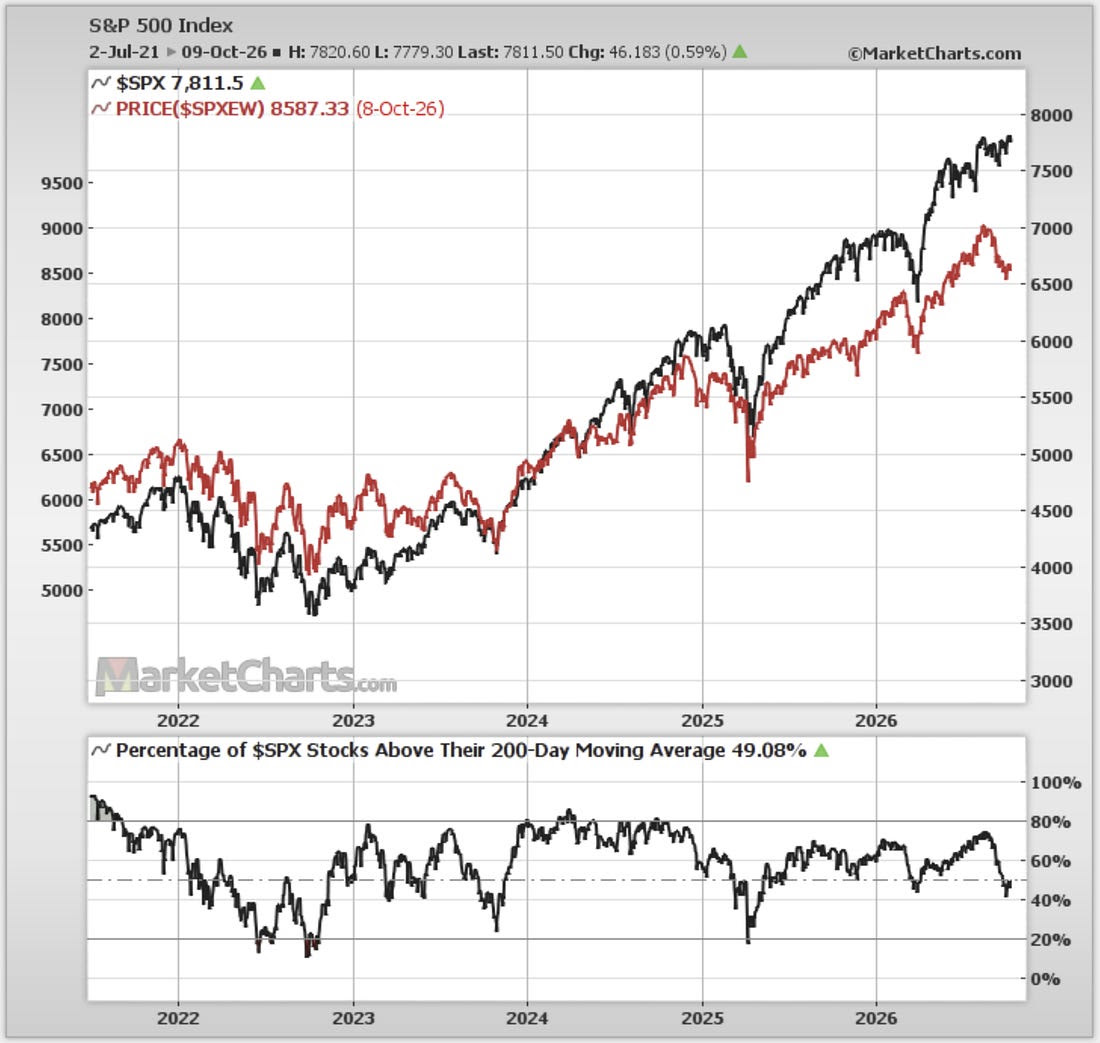
1. Technical Check: after a sizeable selloff, the equal-weighted S&P500 is ticking up off the lows —breadth is also ticking up after a hefty reset. The headline cap-weighted S&P500 is also looking to be shaking-off its period of relative stagnation; likewise ticking up and even notching-up a new all-time-high.
Source: MarketCharts.com
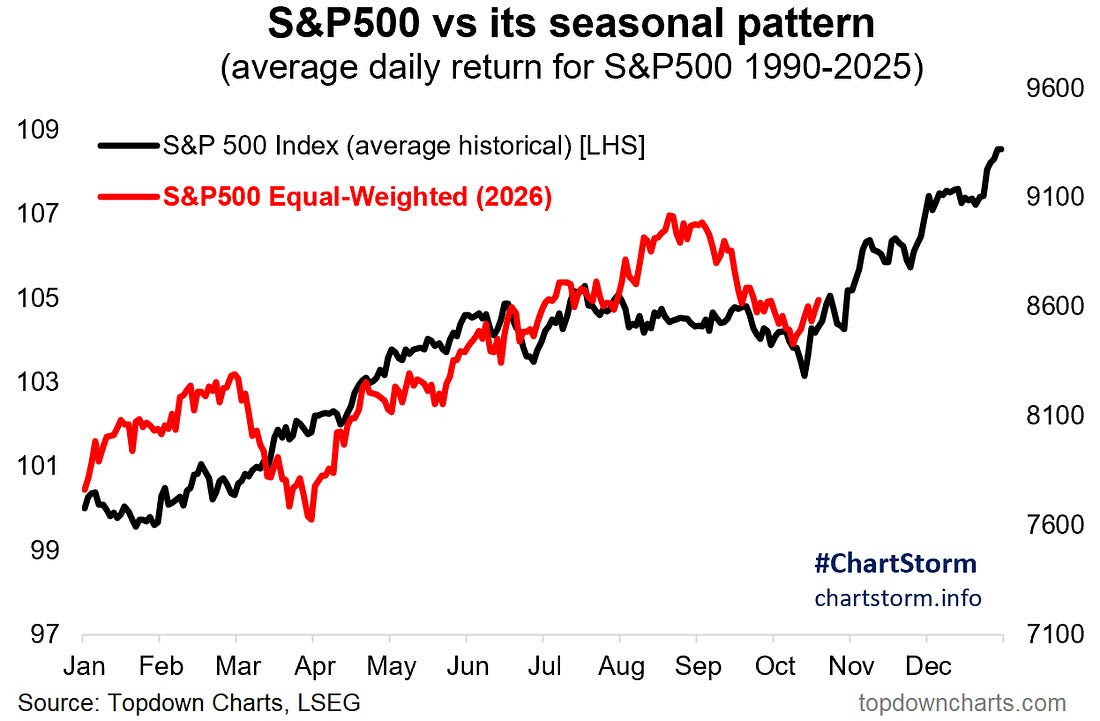
2. Seasonality -did- work after all? Here’s an interesting angle —if you look at the headline S&P500 index we didn’t really get a seasonal slump as many expected…
But if you look at the Equal-Weighted S&P500 it followed the seasonal script very closely: rebounding off the lows almost exactly in line with the typical seasonal pattern for the S&P500.
Source: Topdown Charts Professional
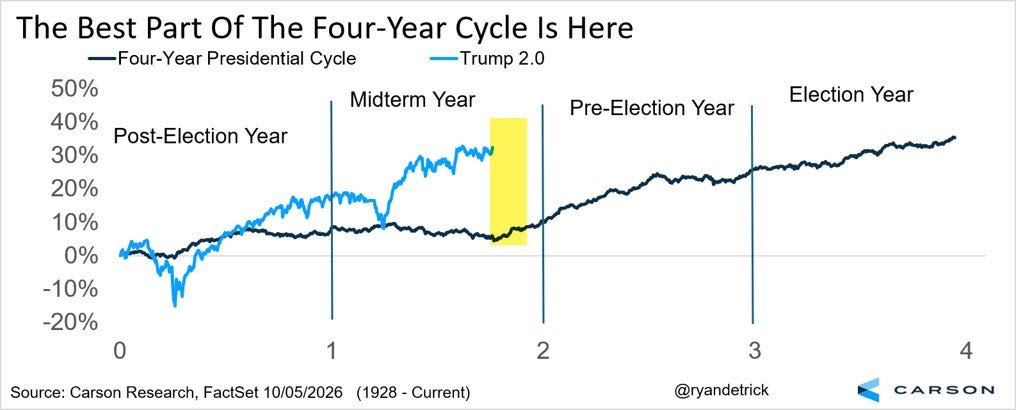
3. Four-year Cycle: the seasonal implication of the above chart added to the below chart of election cycle seasonality would thus imply it’s time for a seasonal year-end rally before kicking into the pre-election year upturn in 2027.
Source: @RyanDetrick
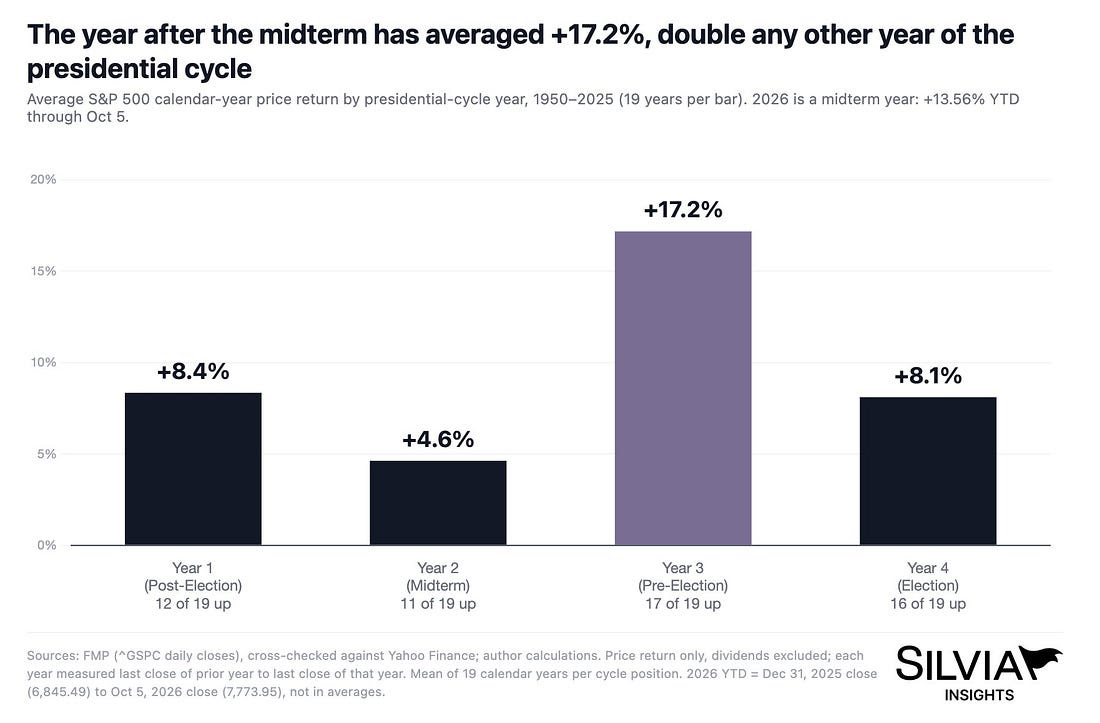
4. Election Cycle Averages: but with all the expectation and anticipation of a post-Midterm rally and year-3 surge, you do have to wonder just a little bit as to whether we might have already brought some of this forward.
For instance, the cap-weighted S&P500 has performed pretty well this year; defying calls for a midterm seasonal slump; and maybe the Iran war messed with the script by driving a big reset back in H1. Doesn’t mean we don’t go up next year, but maybe just temper the expectations.
Source: @philrosenn
5. Semis Slipping: meanwhile semiconductor stocks are not faring as well; SMH has notched up a lower high and breadth has rolled over again from overbought levels. Could be just a blip, but SMH did close lower each of Tue/Wed/Thu/Fri. For what is supposed to be the main engine of the bull market, this is a concerning development.
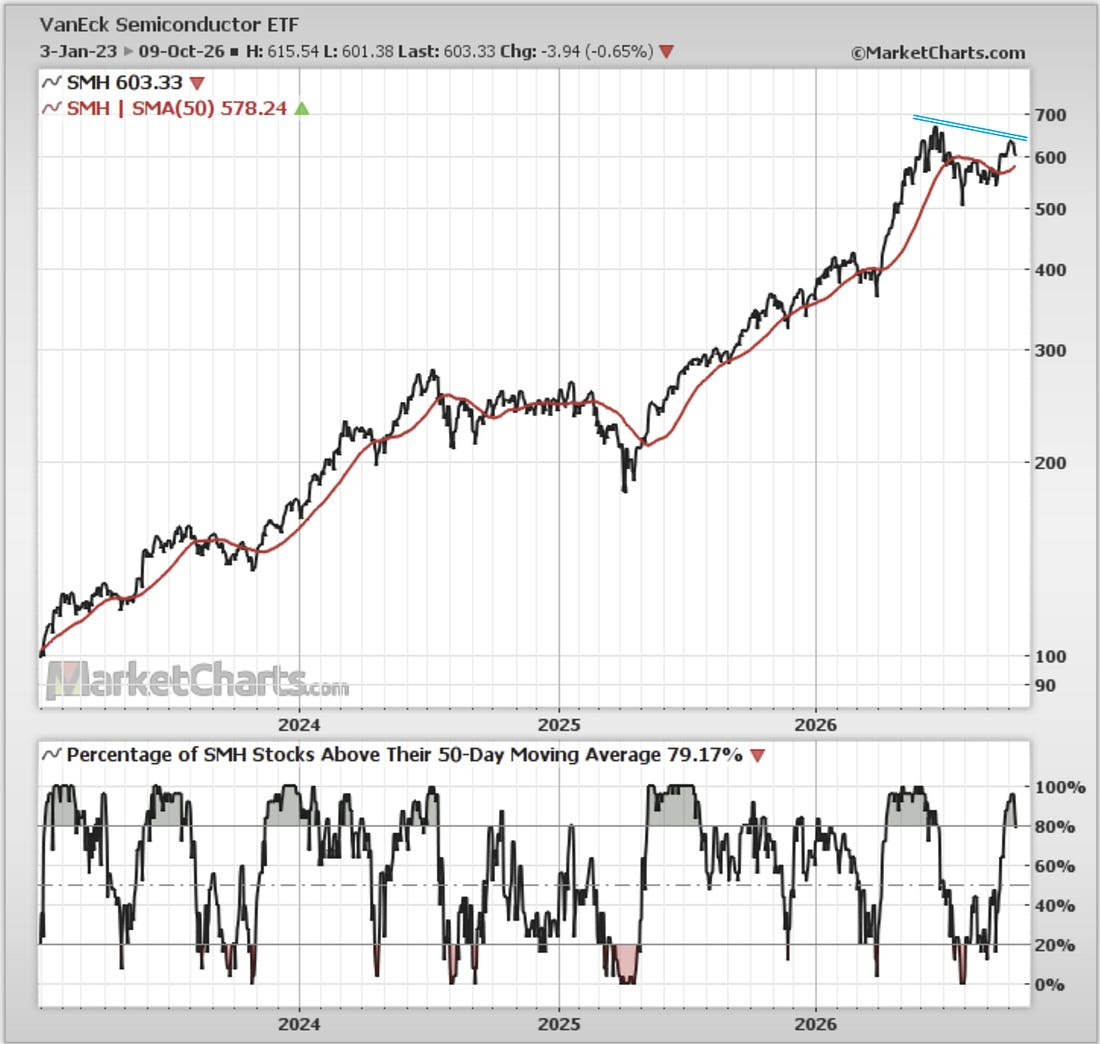
Source: MarketCharts
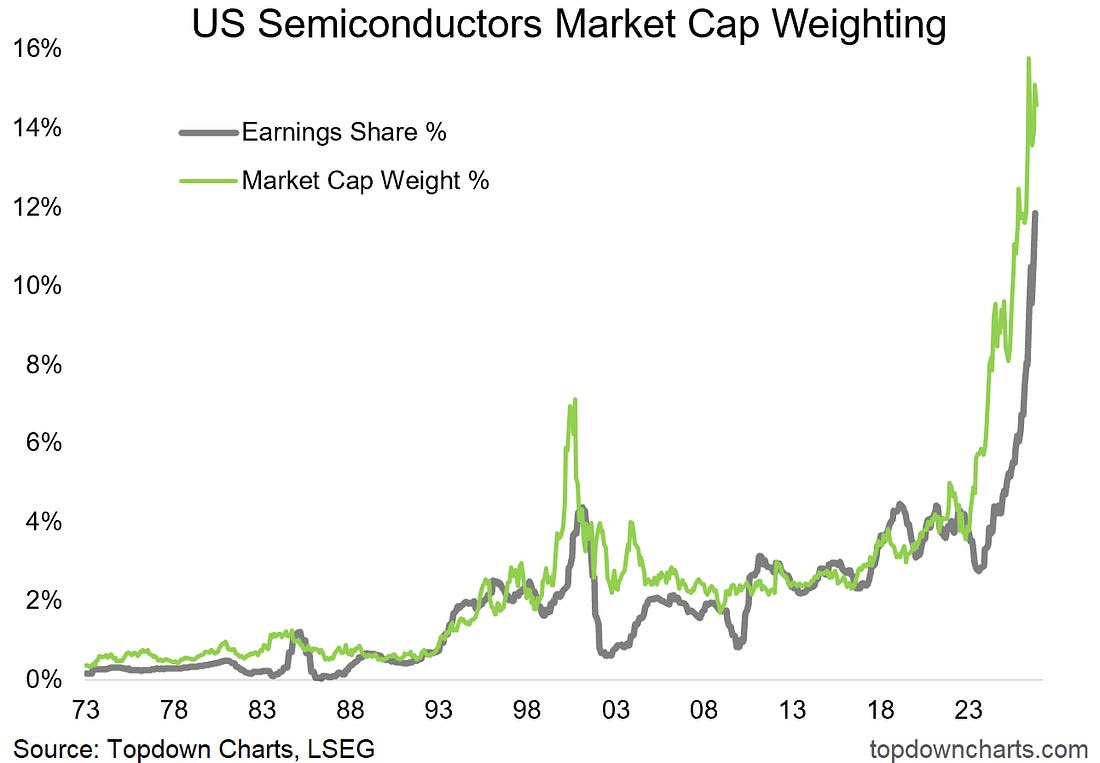
6. Semis Market Cap (and Earnings) Weight: I’ve updated everyone’s favorite chart of US semiconductor sector market cap weighting, which has ticked lower from all-time highs. But this time I also included earnings share weight.
Basically its earnings share does at least partially justify its cap weight share… but the market is basically front-running and anticipating higher earnings share still to come. That gap is where the risk lies. The risk also lies in the prospect of the grey line plateauing or even making a cyclical peak.
Source: Topdown Charts Professional
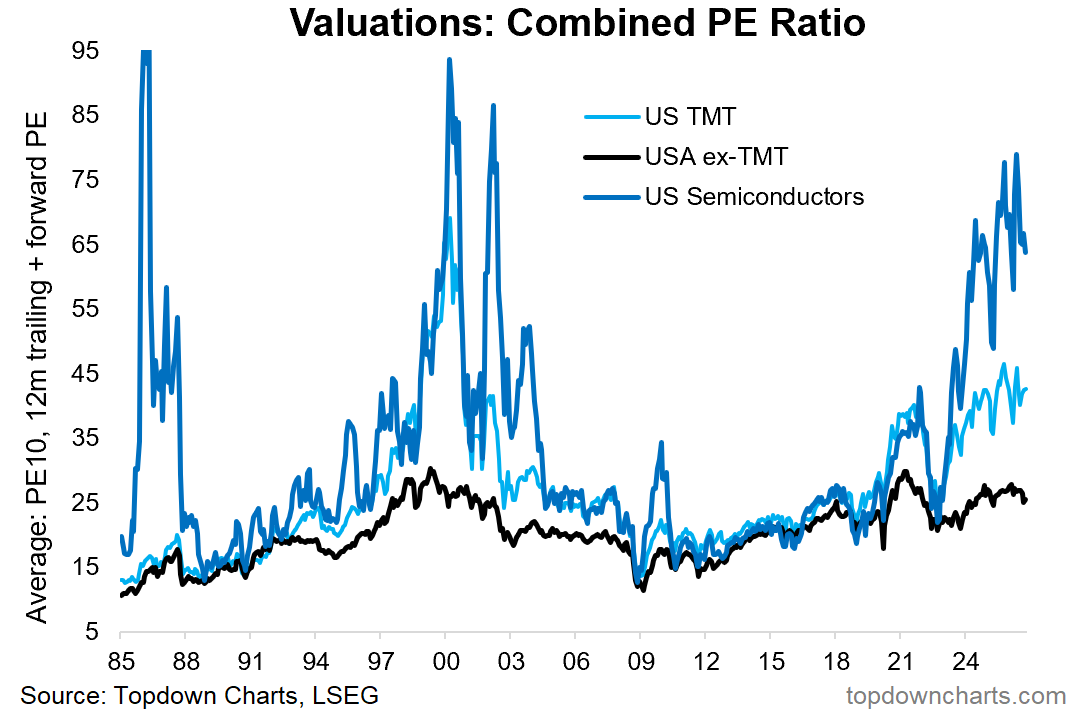
7. Semis Combined PE Ratio: we see this also in the combined PE ratio (and this will make some people angry…) which is the average of the forward PE, trailing PE, and CAPE/Shiller PE. True believers will argue you shouldn’t use that approach because we are in a new paradigm of earnings, which may be true, but at least here it is for all to see and consistently applied over time across semis, broader tech, and non-tech.
It’s the same thing as I noted above, the market is anticipating a new paradigm of earnings for semis, and that’s probably a fair anticipation in the bigger-picture longer-arc of history. But there will be cycles; the next macro downturn will see chip demand pull back; sooner or later there will be at least a moment of overbuilding of datacenters; and maybe chip supply/suppliers will surge as supernormal profits bring stepped up competition. So that’s basically the risk case.
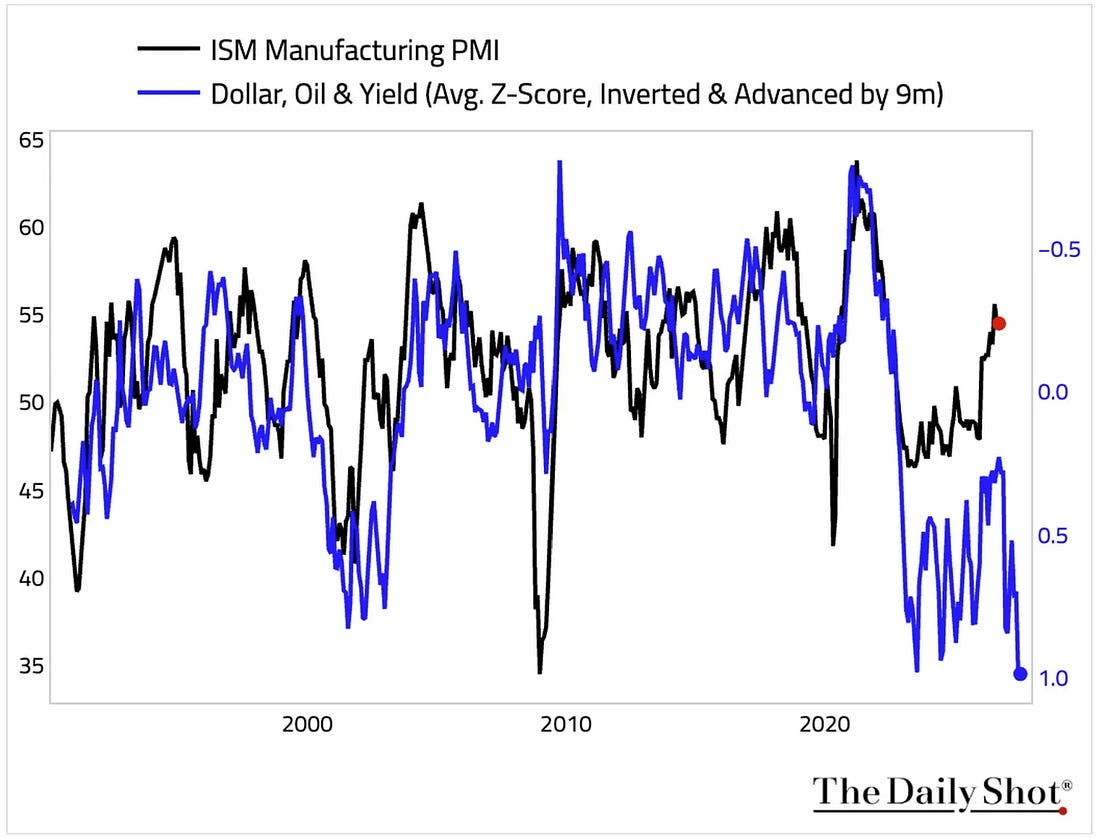
8. Looming Macro Headwinds: on the cyclical outlook, the US economy has been notably strong this year as previous tailwinds work their way through, but increasingly there are a number of headwinds on the horizon. Headwinds don’t guarantee the economy topples over, but it does mean more cross winds and an incrementally deteriorating macro-risk backdrop.
Source: The DailyShot Brief
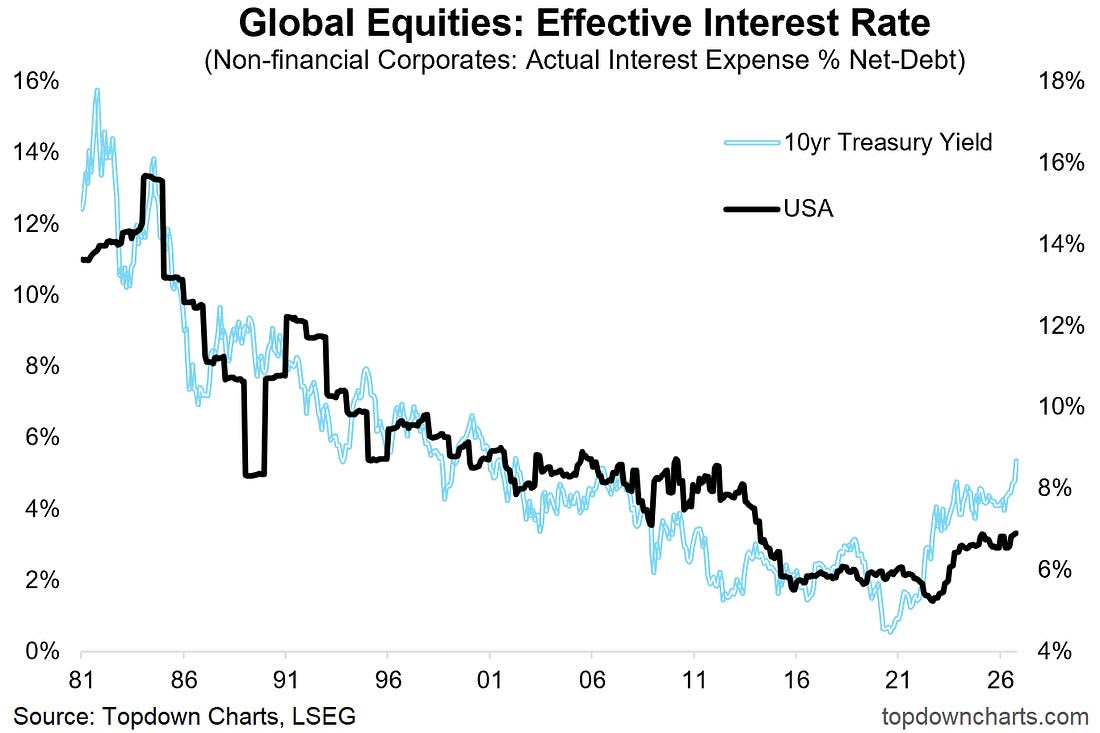
9. Bond Yields vs Effective Borrowing Costs: here’s a look at the effective interest rate that S&P500 companies are paying on their net-borrowing. The recent uptick in yields will likely flow through with a lag, meaning increased interest expense in the quarters ahead. This reinforces the end to the trend of falling effective interest rates over the past few decades (and this echoes what we’ve also seen in effective corporate tax rates). Only one part of the earnings picture, but still part of it.
Source: Topdown Charts Research Services
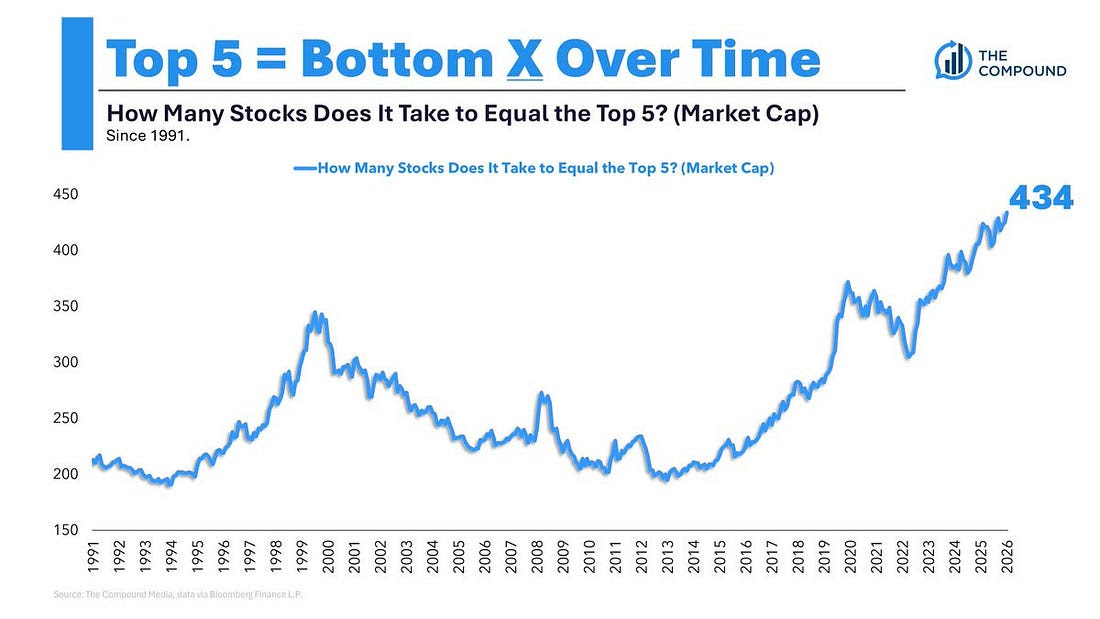
10. Concentration Skews: interestingly the top 5 stocks in the S&P 500 are now equal to the bottom 434. Which is another way to say the top 5 stocks are much bigger than usual. This reflects structural shifts and new technological paradigms, but also market anticipation of a permanently higher path for the earnings of the top-end-titans.
Source: @michaelbatnick

Comments
Log in or sign up to join the conversation.