


The S&P 500 (Index: SPX) continued tracking along above its mean trendline with respect to its trailing year dividends per share in September 2026. The index stayed mostly within one standard deviation of its long-established central trend during the month.
Through the end of trading on Wednesday, 30 September 2026, the index' closing value of 7,651.54 per share is half a standard deviation above its mean trend and is slightly below its trailing 20-day moving average of 7,671.31. The S&P 500's trailing year dividends per share came in at 82.89 per share during the calendar month.
The following chart visualizes the relationship between the value of the S&P 500 and its underlying trailing year dividends per share from 29 December 2023 through 30 September 2026:
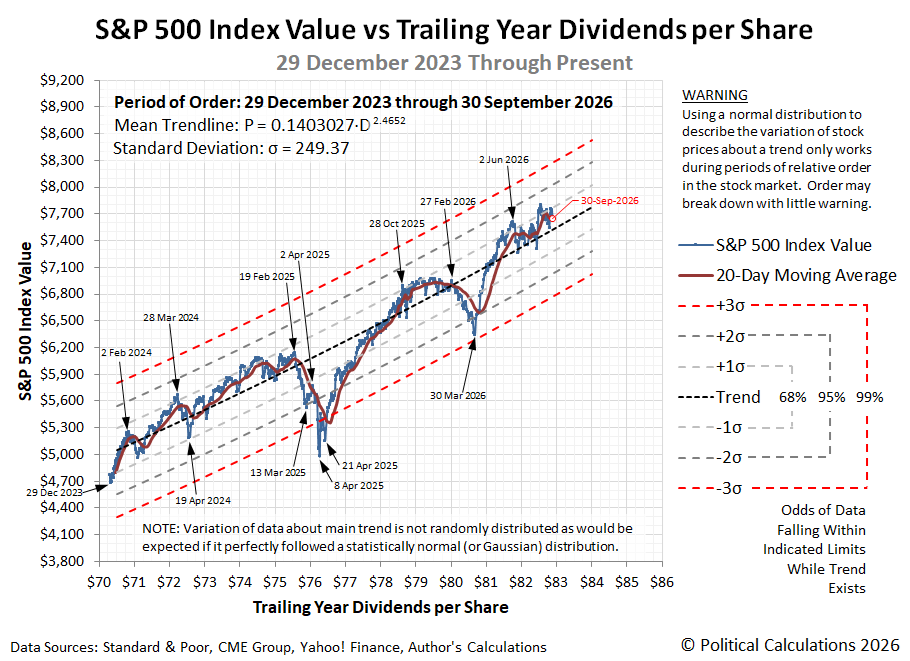
The S&P 500's current period of relative order with respect to the index' underlying trailing year dividends per share has been in place since the end of 2023. While we're using the kind of analysis that applies to standard normal distribution bell curves from statistics to describe the variation of stock prices during that now long-established trend, that variation is not really normal.
You can see that in the data, with a much higher than expected number of data points within one standard deviation of the central trendline than would be predicted using a normal distribution to quantify the variation. There's also a higher than expected number of data points falling more than three standard deviations away from it.
That's a characteristic of a Lévy alpha-stable distribution, which looks more like the red curve on our featured chart illustration than it does like the green Gaussian normal distribution. Which is to say that stock prices can have stable distributions about central trends, but aren't really normal!
Comments
Log in or sign up to join the conversation.