

The S&P 500 (Index: SPX) was heading for a good week. The stock market appeared to react well to news of the Democratic party's sweeps of many elections across the U.S. on Wednesday, 3 November 2026. The index was up almost 1.6% on that news, which seemed contrary to what might be expected for the biggest companies in the index, the Big-AI tech giants, because many of the winning candidates opposed building the data centers they need to support the boom in Artificial Intelligence technologies.
Then Thursday, 5 November 2026 came and the crash that seemed like it should have happened on Wednesday arrived like a ton of weights. It was as if investors suddenly realized that yes, the political party that specifically ran against AI technology development had won power at the federal, state, and local levels of government and would follow through on imposing new regulations and other costs on the AI tech giants. The S&P 500 plunged almost 4.6%, led by AI chipmakers like Nvidia (NASDAQ: NVDA), Micron Technology (NASDAQ: MU), and Advanced Micro Devices (NASDAQ: AMD.
Then Friday arrived and the investors who like to pick through the carrion of market carnage to find deals on heavily discounted stocks found enough among the AI tech sector to boost the index by a little over 0.3% on the day. For the trading week as a whole, the S&P 500 closed the week at 7,376.86, down almost 2.7%.
So what happened on Wednesday to delay the expected drop in stock prices by a day?
The answer turns out to be pretty technical, and to give credit where it's due, Zerohedge provided some of the better reporting of what happened on the day it happened, compiling observations from several sell-side analysts for why the market bounced up instead of realizing the expected drop:
Clarity - the event is passed and Trump "absolutely willing" to accept the results and a 'medium bad' outcome for Republicans
Gridlock - lowers the risk premium. Dem majority plus Trump’s willingness to work with it “should act as a break on extreme policy outcomes and bring down risk premia” - DB Saravelos.
Plunging Oil - recognition of Iran War as reason for Dem Sweep, Trump confirmed he wouldn't escalate in Iran any time soon, and "expect Dems to use fiscal deadlines to seek to limit the war with Iran" - GS Hatzius
Hopes of Tariff Rollback - "...roll back selected tariffs, and reverse spending cuts enacted last year." - GS Hatzius, and it fits who led today with AAPL/MSFT surging as investors perceived the stock as a winner from the Democratic sweep.
Hedges Unwound - deeply in the money protection was sold (driving down vol and sparking the heavy delta/gamma flow-driven rebound)
Technicals - NDX bounced off its 200DMA
Rotation - Money is moving out of AI CapEx (on worries that Democrats will regulate AI more) and into cash-generating MegaCaps.
Seasonality - 6 months after the past 19 midterm elections, SPX higher 100% of the time, with an average gain of 14.18%.
We are sure there are more (obviously aside from the classic 'relief rally' argument), but those all seemed to add up to what we saw today...
It was enough to last for a day. And then the Thursday, 5 November 2026 AI Crash happened, where we're now wondering if stock prices are themselves experiencing a regime change. That possibility is hinted at in the latest update, where we find the trajectory of the S&P 500 has dropped well below the range we would expect to find it when investors are focused on the current quarter of 2026-Q4 in setting current day stock prices.
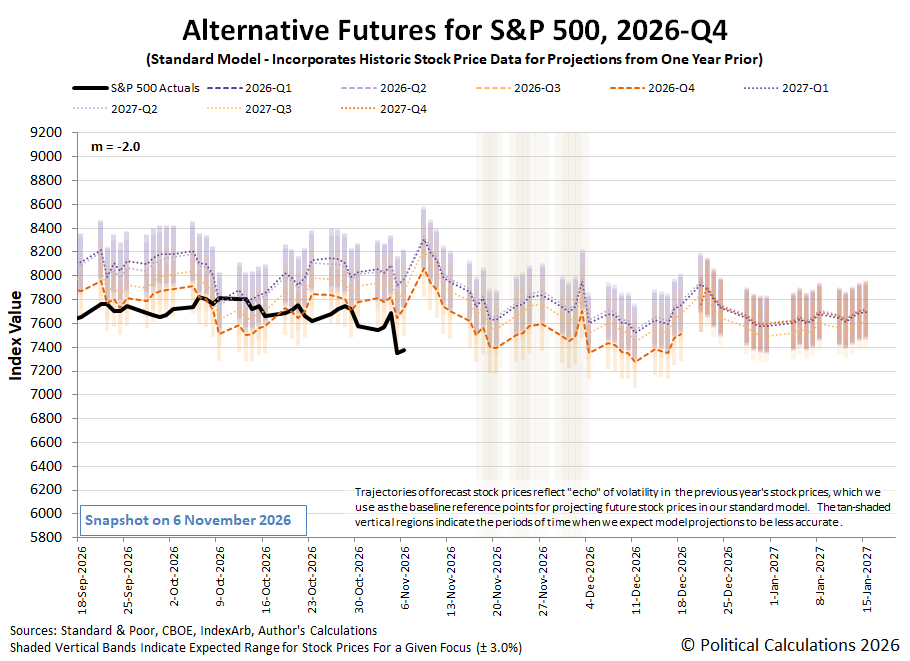
It's too early to tell using the dividend futures-based model since we have to identify potential changes in market regime from observations. On one hand, we have a Lévy flight event where the trajectory of the index has broken away from all of the alternative trajectories it would be expected to be found in the established market regime that's been in place since 28 April 2025. On the other hand, we see that trajectory is on par with where the model would put it in early December 2026, assuming investors are still focusing on 2026-Q4.
The difference between the model's projections in November 2026 and December 2026 could be attributed to how its projections work. Here, its projections a month into the future are "locked in", while its projections of the more distant future are still dynamic and can adapt and provide accurate predictions assuming the existing market regime still holds.
We'll find out which scenario applies in the weeks ahead as investors absorb the random onset of new information from the newstreams. Like those they absorbed from the market moving headlines of the week that was.
Monday, 2 November 2026
Signs and portents for the U.S. economy:
Fed minions fear inflationary impact of El Nino:
Bigger trouble developing in China:
Bigger trouble developing in Japan, South Korea:
EU minions dismayed by EU trade with US and value of AI companies. Also getting excited to hike Eurozone interest rates in December:
Nasdaq, S&P 500 fall behind ahead of U.S. midterms, key earnings results
Tuesday, 3 November 2026
Signs and portents for the U.S. economy:
Bigger trouble, stimulus developing in China:
BOJ minions getting excited to hike Japan's interest rates again in December:
ECB minions lining up behind December interest rate hike in Eurozone:
S&P 500, Nasdaq end higher as markets weigh on U.S. midterms
Wednesday, 4 November 2026
Signs and portents for the U.S. economy:
Bigger trouble, stimulus developing in China:
ECB minions getting excited again to hike Eurozone interest rates, predict wages in Eurozone will rebound next year
Dow has best day in 1.5 years as traders assess a Democrat sweep
Thursday, 5 November 2026
Signs and portents for the U.S. economy:
Fed minions want to go slow on U.S. interest rate hikes:
Growth signs developing in Japan:
ECB minions getting excited again to hike Eurozone interest rates again:
Friday, 6 November 2026
Signs and portents for the U.S. economy:
Fed minions expected to deliver quarter point rate hike in December 2026, say they don't care about AI tech stock crash:
BOJ minions have a fever, the only prescription is more rate hikes, at least until they hit a two percent yield:
S&P 500 reports weekly losses as technology rout weighs on markets
The CME Group's FedWatch Tool sees just two more increases in the Federal Funds Rate in the weeks ahead. It continues to anticipate the Fed's next rate hike will be a quarter point, coming on 9 December (2026-Q4). The other rate hike the FedWatch tool foresees would be another quarter point increase that would take place on 17 March (2027-Q1).
The Atlanta Fed's GDPNow tool projects the current quarter of 2026-Q4's inflation-adjusted economic growth rate will be +3.4%, up from its initial estimate of 3.2% a week earlier.

Comments
Log in or sign up to join the conversation.