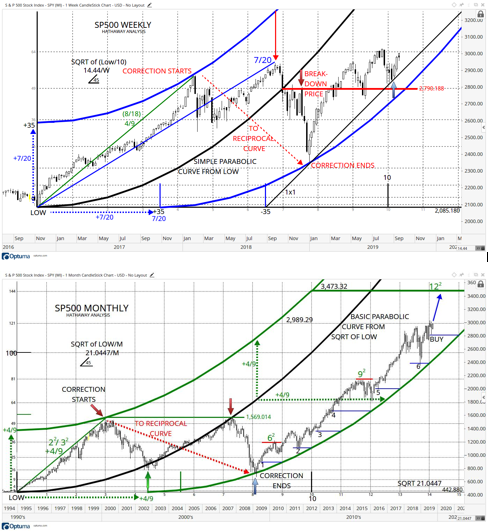
S&P 500 weekly parabolic structure has the same verification of a resumed uptrend through the EXACT parabolic curve technique as seen in the monthly chart. (2nd chart below is a monthly chart featured in post 2 days ago.) The square root of the weekly low of Nov 7, 2016 (election low) of 2.085.18 is used but divided by 10 (SQRT 208.518 = 14.44....). This figure is used for the parabolic curve structure AND the crucial price/time geometric ratio (important for angles, not the curves). (Note: These charts are made with my Hathaway Parabolic Curve tool with squares grid in my tool kit on Optuma charting platform).
(Click on image to enlarge)
Comments
Log in or sign up to join the conversation.