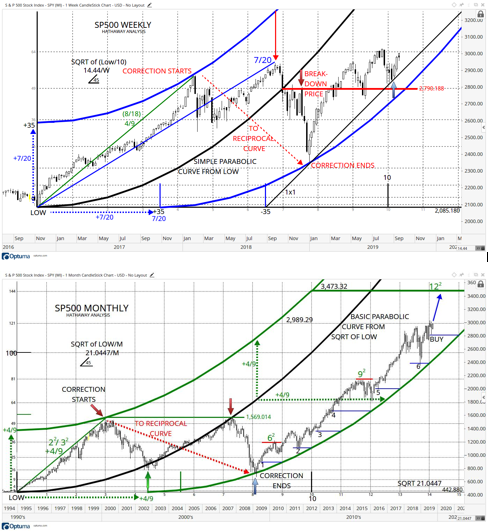
Since the Dow has broken above major resistance, as represented by the 20/8 sine wave top at $27,301.70, horizontal red dashed line on the charts, the long-term uptrend is anticipated to reach the next sine wave 25/8, or the 5th multiple of the crucial 5/8 wave. That would put the Dow in the area of 32,770 to 33,130 by election time, approximately one year from now. The time window is Oct./Nov. 2020 – the next major reversal timing area. That would indeed by the ‘make or break’ time.
(Click on image to enlarge)
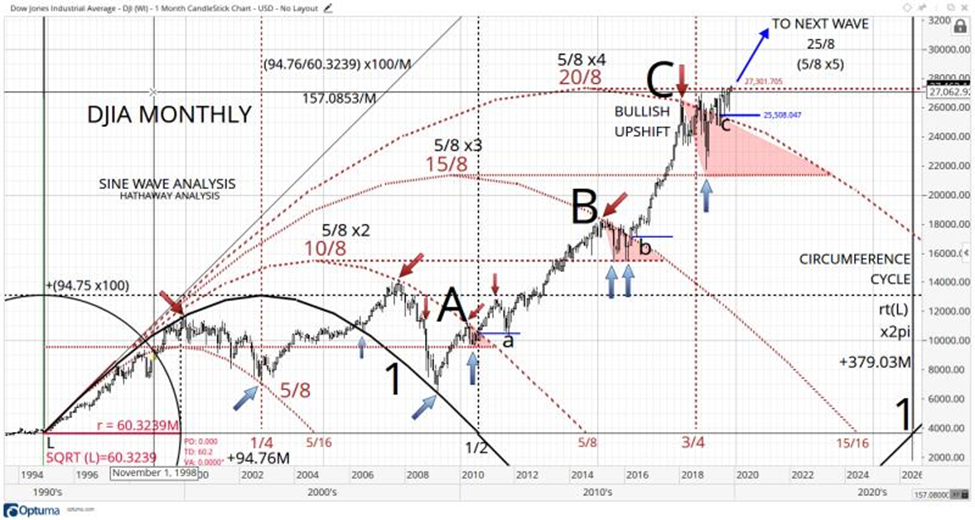
1) If a top does occur around the 33,000 price zone, a major bear market would be underway, as this is the next timing to match all top areas since the 2008 crash, (Apr '11, May '15, and Oct '18) using my Hathaway Analysis proprietary timing technique.
2) If a secondary low forms around the recent 20/8 sine wave top at 27,303, then a continuation of the major bull run can be anticipated, as the last move to a MAJOR top proceeded by a devasting bear market.
(Click on image to enlarge)
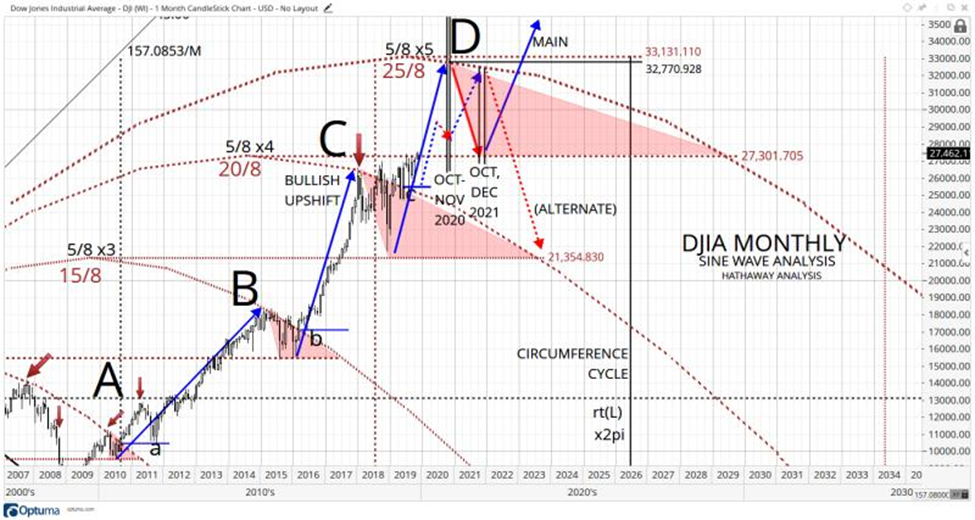
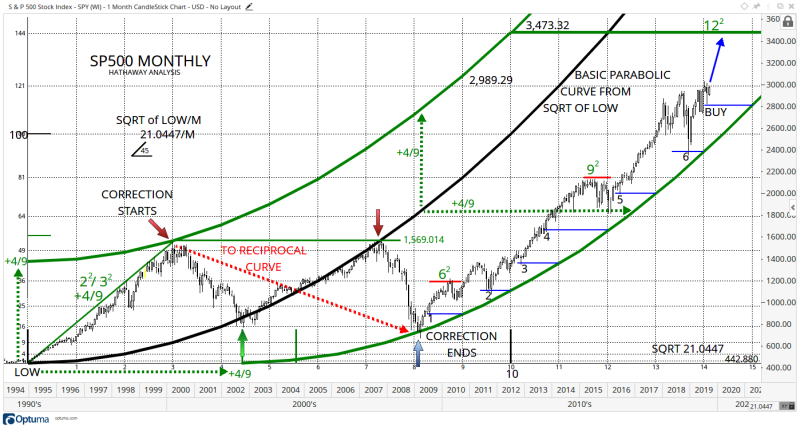
This next chart shows a close-up of the possible scenarios. The market repeats itself, several times. Note that the time points of Oct./Nov. 2020 and Oct./Dec. 2021 come from my proprietary Hathaway Analysis timing methodology.
Comments
Log in or sign up to join the conversation.