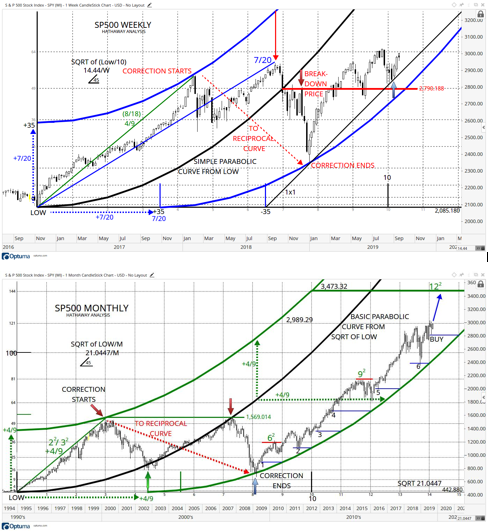
My Parabolic Curve tool (on Optuma) and extension concepts applied to this SP500 monthly chart clearly identify major reversals and their relationships to the square root of the important low of December 1994 of 442.88.
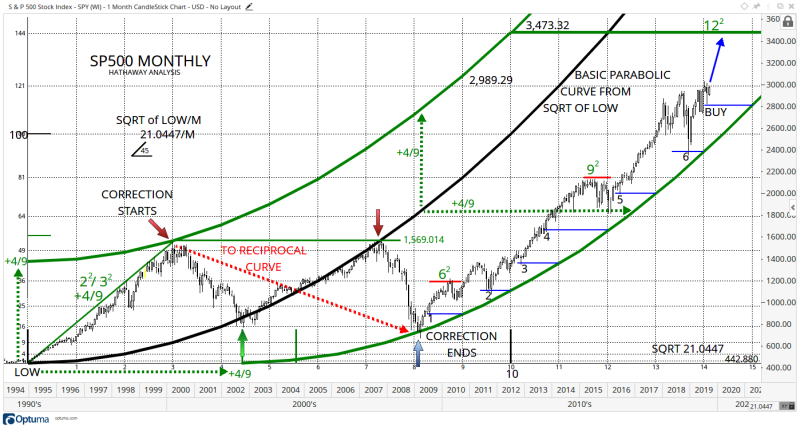
More importantly, support buying points since the 2009 low are clearly identified by the series of support levels (short blue horizontal lines) from each intersection of the support curve (from +4/9 on the time line ('x axis') with each time line of the PC grid (numbered 1-6).
Notice the tops at 6sq & 9sq grid levels (short red horizontal lines) giving 12sq level of 3,473.32 as the next sequential resistance level.
Wouldn't it be interesting if the Gold market had a similar set-up..?!?! (Coming next...)
Comments
Log in or sign up to join the conversation.