


Stocks fell on Tuesday, with the S&P 500 down around 70 bps. Not much has happened in the index since the end of July, and aside from the three-day gamma squeeze following megacap earnings, not much has really happened since June 2. In fact, the index closed today at 7,631, versus 7,609 on June 2. Anyway, the point is that there has been almost nothing going on in the market for nearly three months. I get the feeling that could be about to change.
We are now entering a period where dispersion will be dead. Earnings-season dispersion is about a month away, and after Broadcom reports, whatever is left of single-stock volatility should unwind. This means we should see correlations begin to rise in a more meaningful way, and the market should start trading as one.
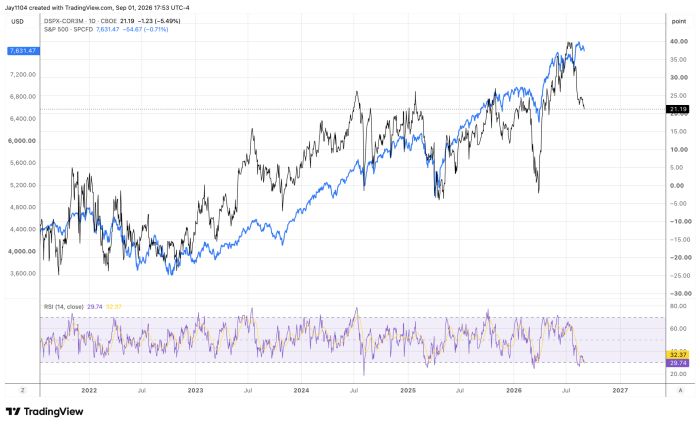
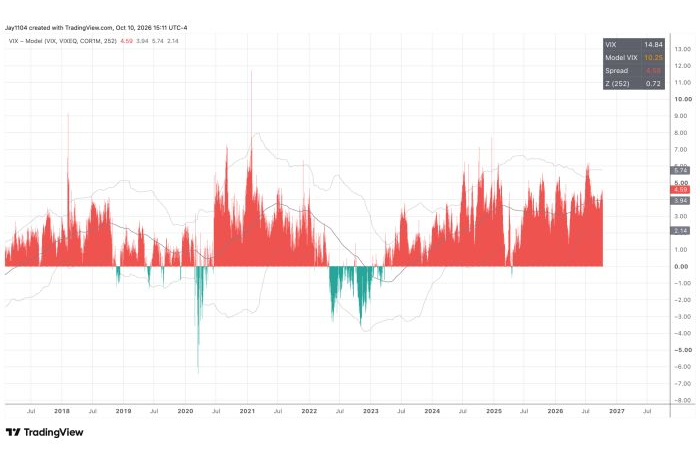
The spread between the dispersion index and the three-month implied correlation remains very wide, and I expect it to continue narrowing. The crazy thing is that the spread today is still nearly as wide as it was at the four prior peaks, all of which saw dramatic declines. So there could still be further for this spread to contract, and typically, where the spread goes, the S&P 500 follows.
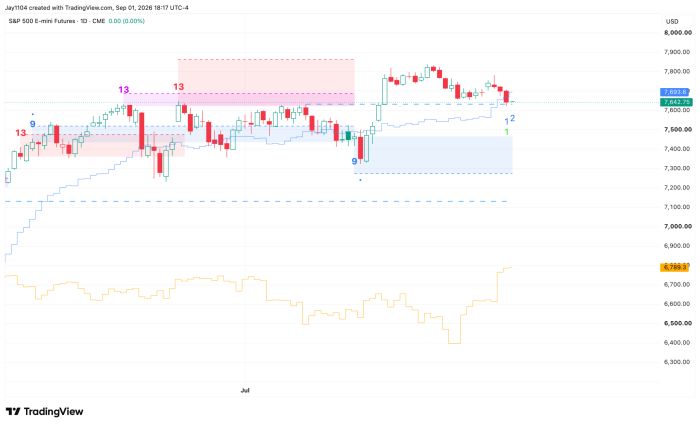
The one question that carries some importance is whether CTAs become sellers. My model and estimates show that we are either at that flip point or very close to CTAs becoming sellers. That could bring out systematic selling flows that could weigh on markets over the next couple of weeks. The Market-on-Close imbalance should be a good indicator of when and if that shift occurs.
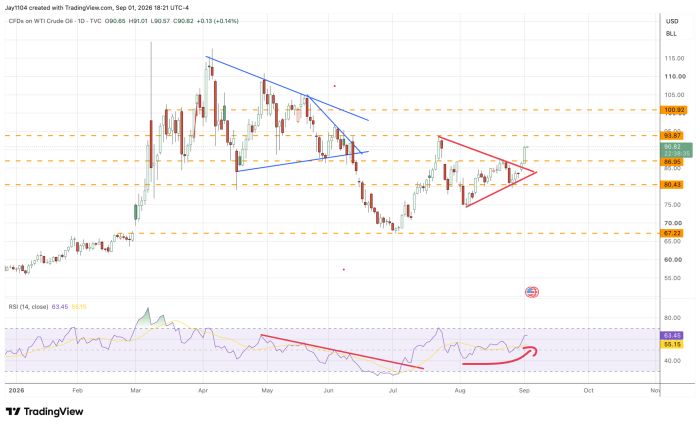
Oil prices rose above $90 today in what appeared to be a rather clean breakout, with the RSI also turning higher and showing bullish momentum. For now, resistance sits around $94, and above that, we could see oil heading back to $100.
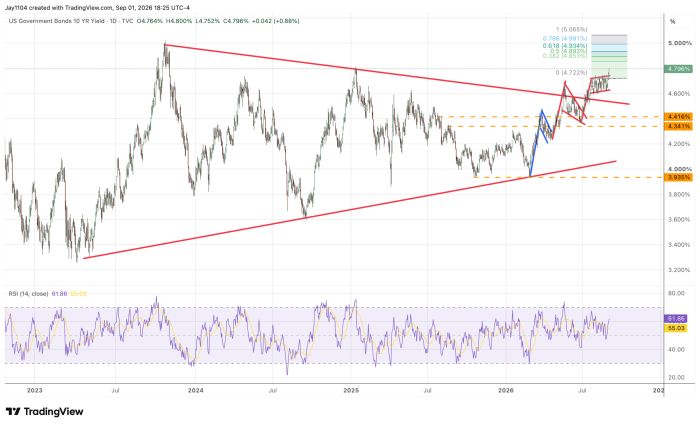
If oil is going to continue higher from here, then 10-year yields probably have further to go as well. It could even push the 10-year toward 5%. I would, though, like to see the 10-year pull back some first, either ahead of or after the jobs report, to give it a chance to consolidate and perhaps even test support. Either way, I don’t think it matters much in the end. Inflation is pushing higher, and global rates are rising, probably continuing to push rates higher in the end.


Comments
Log in or sign up to join the conversation.