


The S&P 500 made a very nice rebound from the 7,600 area, which we highlighted previously, and it appears that the market is now entering a new stage of recovery with room for further strength. Price is already attempting to move above the important 7,761 resistance, suggesting that more upside is possible within wave five, which could represent the final leg of an ending diagonal.
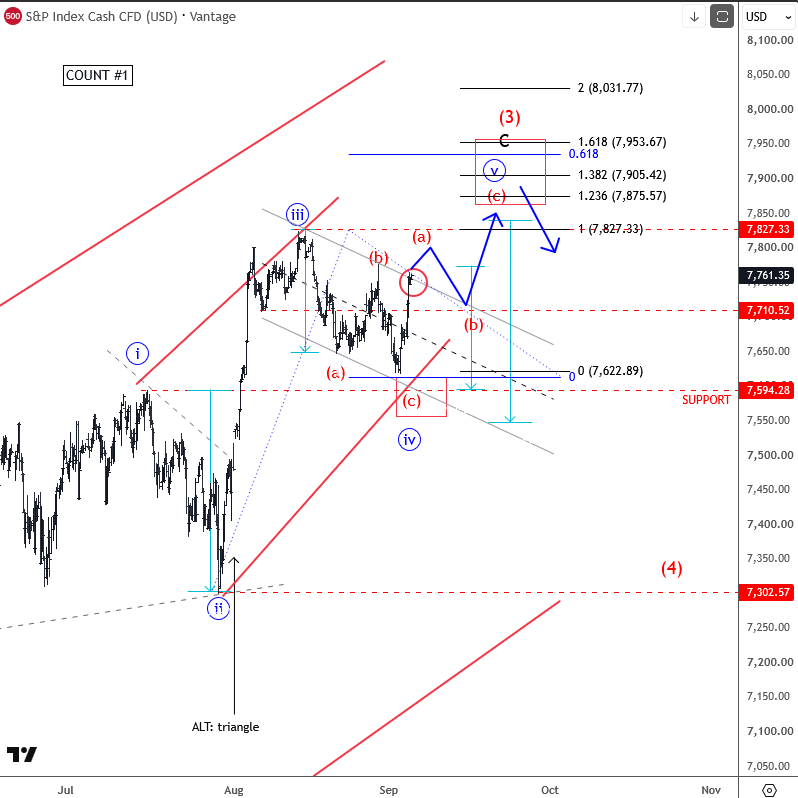
However, once the index reaches new highs, traders should be aware of a potential slowdown. Important resistance is seen between 7,875 and 7,950, where the market could lose momentum and potentially complete a higher-degree wave five, as shown on the daily chart.
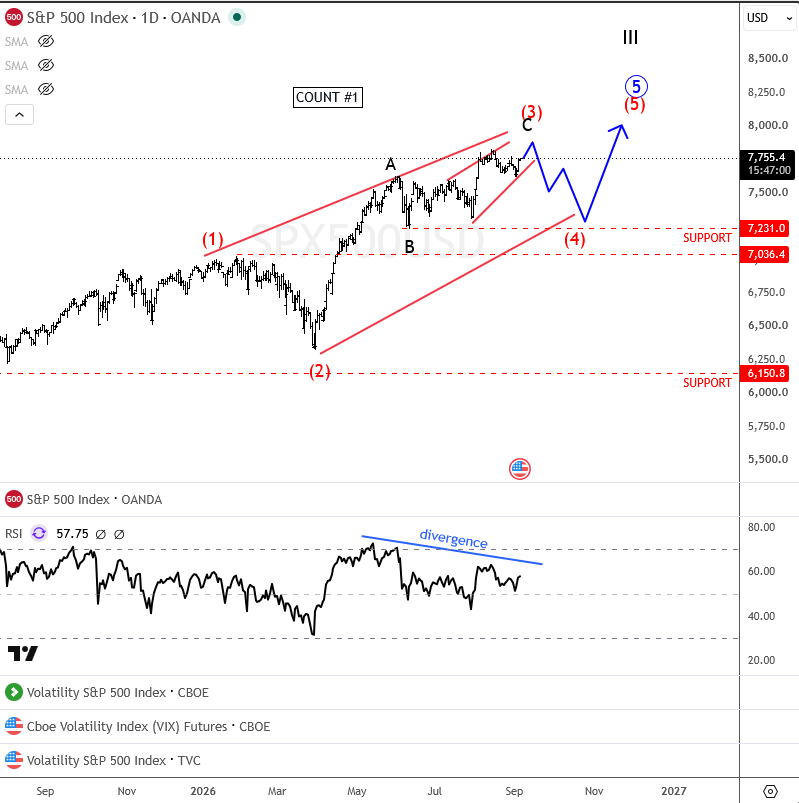
Looking at the bigger picture, the daily chart still shows a very solid uptrend with room for additional upside within a potential ending diagonal. At the same time, the red wave four remains an important risk to watch, while RSI divergence suggests that bullish momentum could gradually start fading.


Comments
Log in or sign up to join the conversation.