


US Treasuries continue to face significant selling pressure, with the downside move accelerating after the break below triangle support around 109, a level we highlighted several weeks ago. The price structure suggests that wave five is now underway. However, with the market already breaking below the 2024 lows, the current decline may be approaching its final stages. There is still room for an extension toward 103 or even the 99 area, where a lower-degree five-wave bearish impulse could be completed before the market stabilizes.
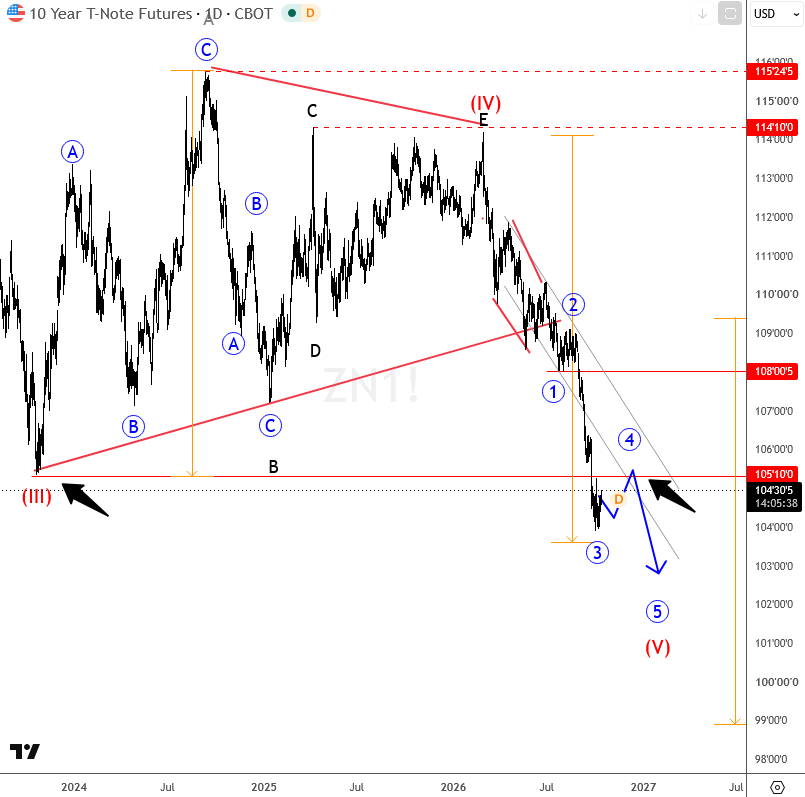
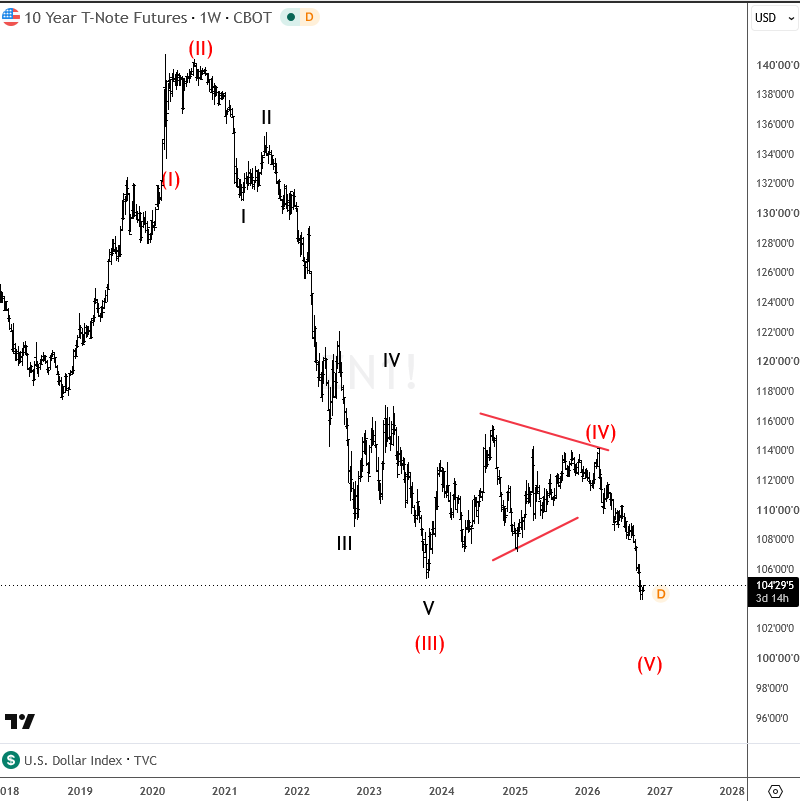
Big picture:
Wave (V) of the larger bearish impulse in US Treasuries may be approaching completion. If the projected structure plays out, we could see a broader recovery in Treasury prices toward the end of 2026 or the beginning of 2027, potentially accompanied by a reversal in yields.
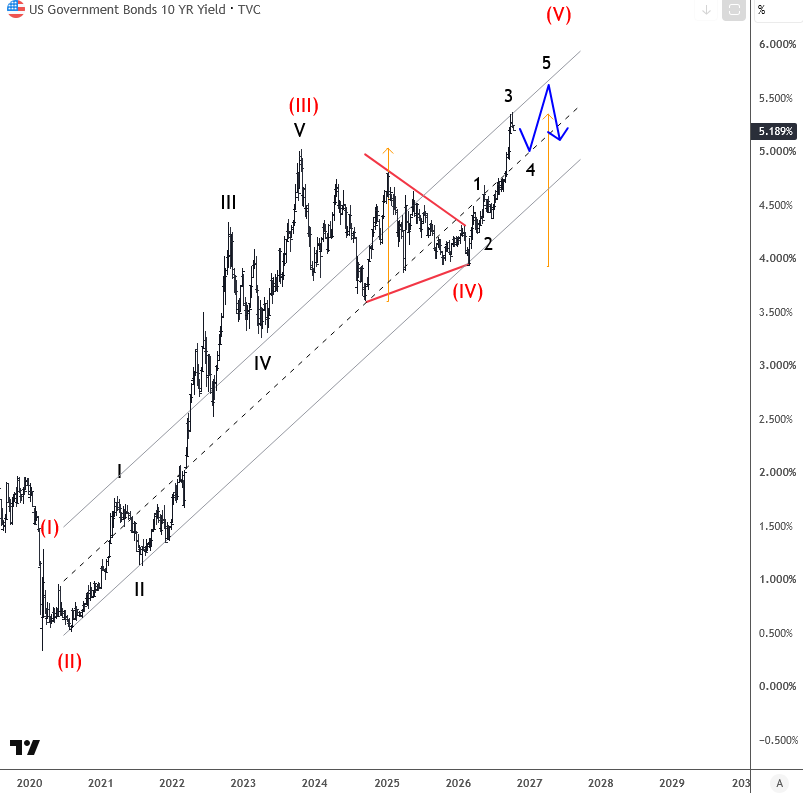
Meanwhile, the US 10-year Treasury yield is pushing above the 5% level, with potential upside toward the 5.3%–5.5% area. This zone is becoming increasingly important for global markets, as persistently rising yields could continue to influence risk sentiment across stocks, crypto, and other risk-sensitive assets.


Comments
Log in or sign up to join the conversation.