


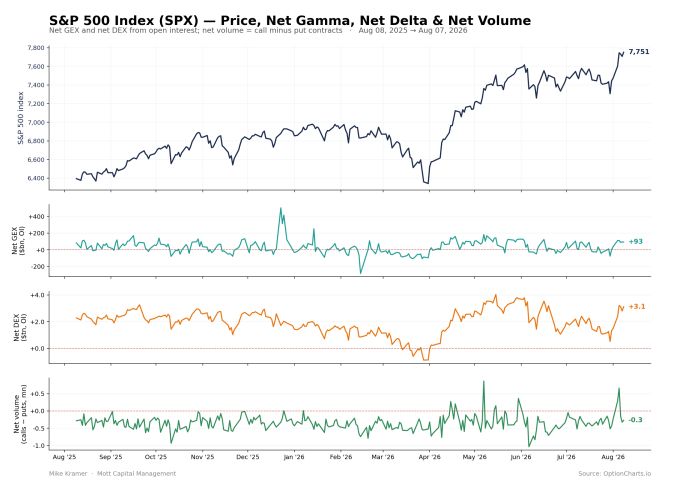
Stocks rallied on Friday, but I think it’s fairly clear that the gamma squeeze has run its course, and the market has largely returned to normal trading flows. Net options volume shifted back toward puts leading calls after the sharp surge in activity earlier in the week that pushed the market from a negative gamma regime into a positive one.
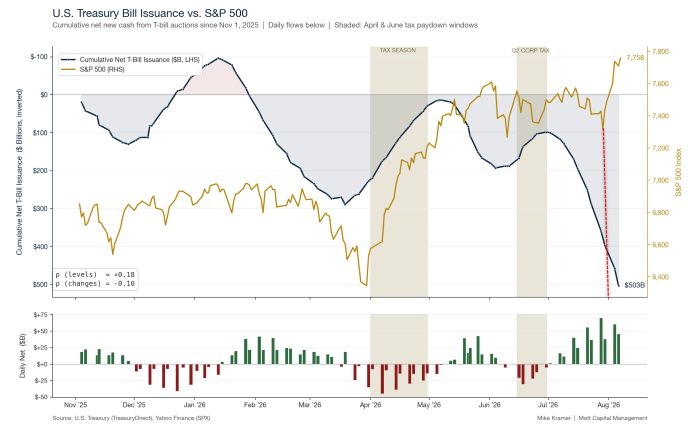
T-bill issuance will remain heavy over the next few weeks, so liquidity should continue to be an important driver of the market. Until the recent three-day rally, that relationship had been working quite well. This episode, however, shows that forces outside of liquidity can still dominate market direction. Overall, as the chart illustrates, the market has tended to move in a slow, grinding fashion, and I would not be surprised to see that downward-tilting grind resume.
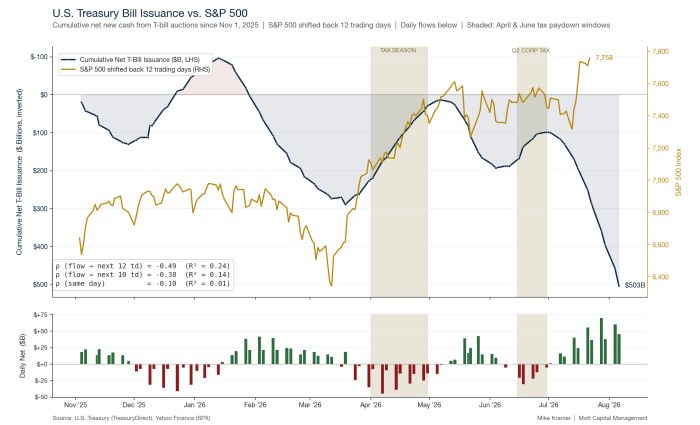
The next chart shows what happens when the S&P 500 is shifted back by 12 days. The correlation strengthens from -0.10 to -0.49, with the R² increasing to 0.24. If the effects of the liquidity drain are strongest roughly two weeks after the actual drain date, then we are only now entering the period when the market should feel the greatest impact.
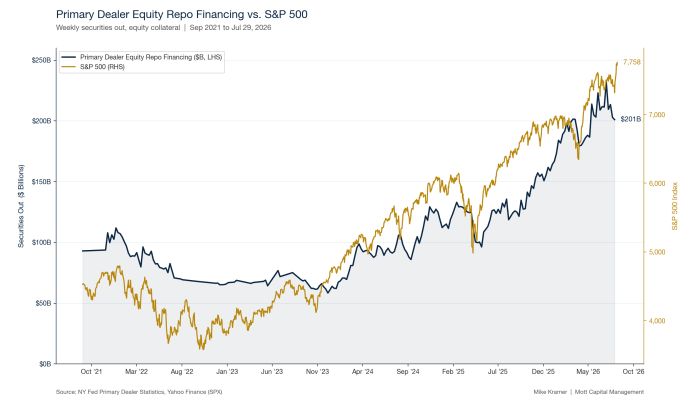
Additionally, equity repo financing activity, as tracked by the New York Fed, has declined in recent weeks. While the data currently only extends through July 29, the reports for the weeks ending August 6 and August 13 will be particularly important. We’ll have to wait for those releases, but if the market continues to rally without a corresponding pickup in equity repo financing, it would suggest that forces other than liquidity are driving the advance.
Additionally, we have begun to see some activity in the five-year USD/JPY cross-currency basis swap. While the move has been modest, it could be an early sign that hedging demand is increasing. With both U.S. and Japanese policymakers seemingly unwilling to tolerate further yen weakness, increased currency hedging could divert dollars away from the equity market and reduce a source of liquidity for risk assets.
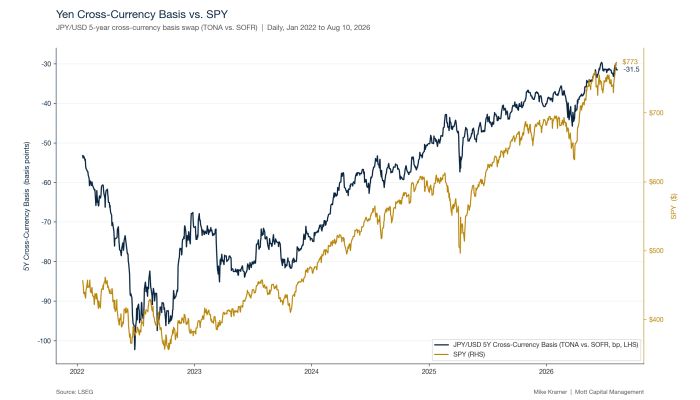
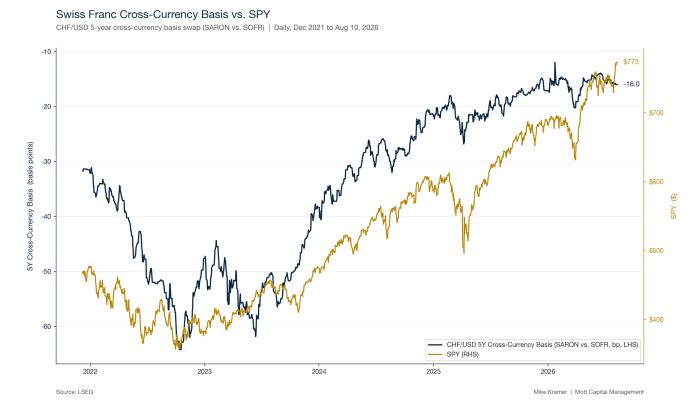
The same is true for the five-year USD/CHF cross-currency basis swap.
So, if liquidity continues to tighten as it has been, and the gamma squeeze has indeed run its course, I would expect the market to return to the environment that existed before the squeeze began.
Anyway, I guess we’ll see where things stand when I return next Saturday.



Comments
Log in or sign up to join the conversation.