


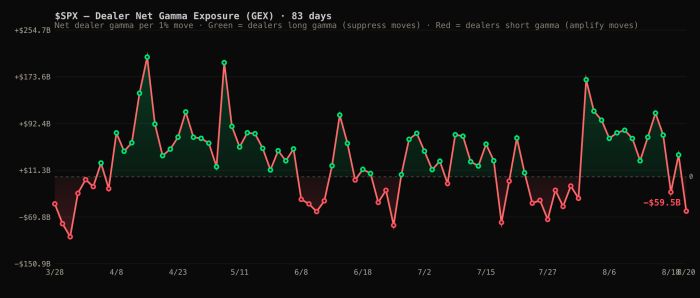
The S&P 500 fell by nearly 90 bps today and closed below its 10-day exponential moving average for the first time since July 31. That could be important, as that moving average can at times signal a reversal in trend. It is also important that the index has now flipped back into negative gamma, which could mean volatility expands as dealer hedging flows move with the market, based on my math.
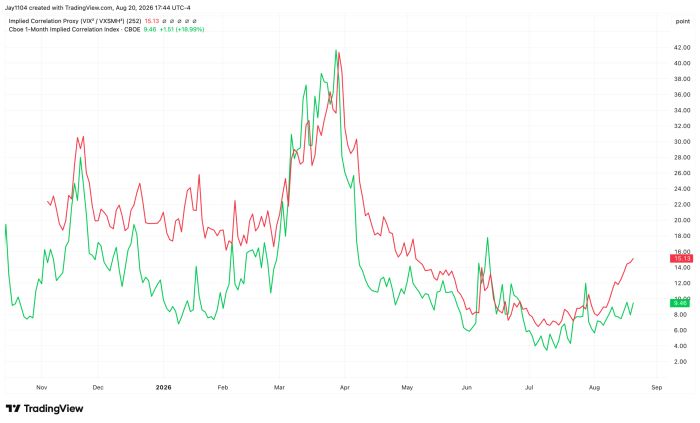
Correlations rose again today, and the semiconductors appeared to see their implied correlations rise a bit faster as well. Basically, we are no longer at a point where the semiconductor ETF’s implied volatility is rising faster than the index’s. That is important in some ways because index volatility had been largely suppressed, and that at least changed today following yesterday’s VIX OpEx.
Something to watch will be whether the VIX continues to rise faster than the VXSMH in percentage terms. If the VIX is rising faster, implied correlations should steadily rise. That would be a sign that the S&P 500 could head lower. When implied correlations fall, the S&P 500 generally rises.
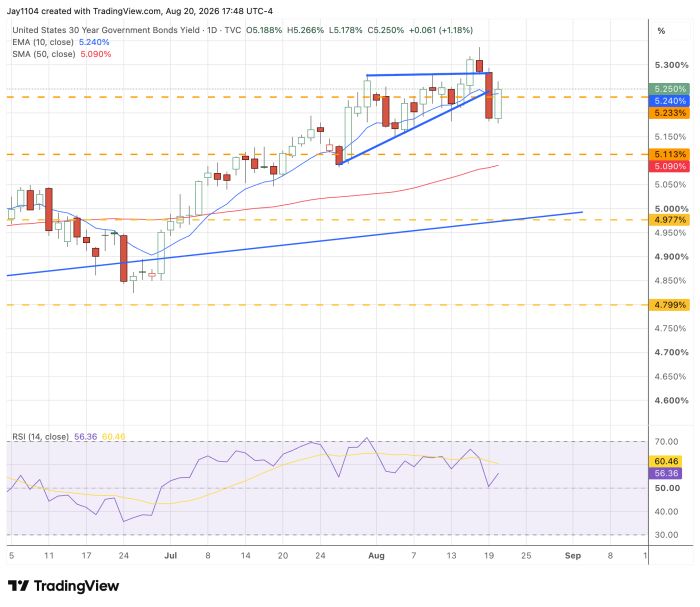
The 30-year rate rose by 6 bps today, largely reversing yesterday’s decline. More importantly, the Treasury Secretary pretty much confirmed that there has been a lack of liquidity in the 30-year Treasury more recently, and that part of the reason for increased buybacks seemed fairly obvious to me. However, I’m not sure buybacks will help much, given that the move in rates is not a US problem but a global one.
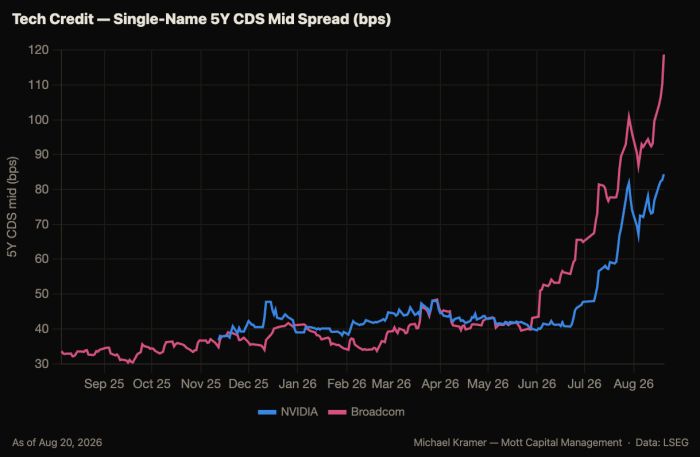
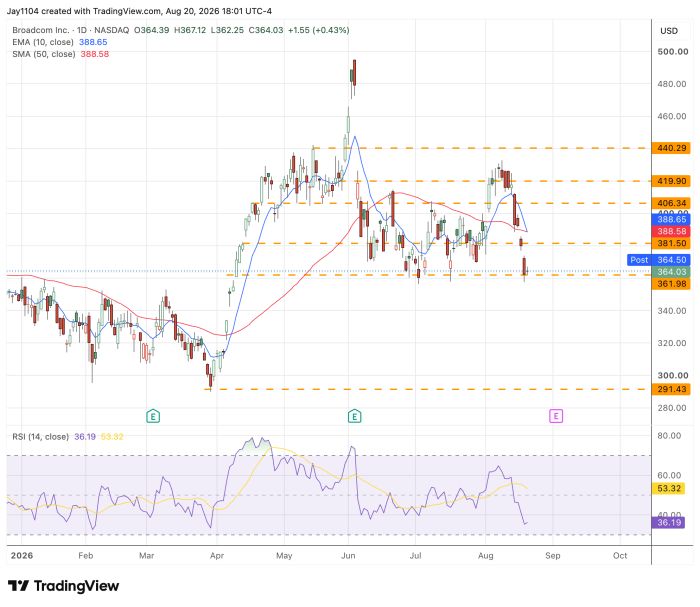
Well, part of the mystery surrounding why we have been seeing CDS spreads widen across the semiconductor sector may have been solved. Today, it was revealed that Broadcom (AVGO) is looking to raise up to $60 billion in debt to fund its AI buildout. The credit market has been right to worry about increasing debt loads, and it will be interesting to see whether spreads continue to widen now that this news is out. I’m guessing they will widen further, and not just for Broadcom.
Luckily for Broadcom, $360 has been the put wall helping to support the stock. However, that should be gone tomorrow after the expiration rolls off, and there is a lot of room for the stock to fall on the technical chart if the $360 support breaks.
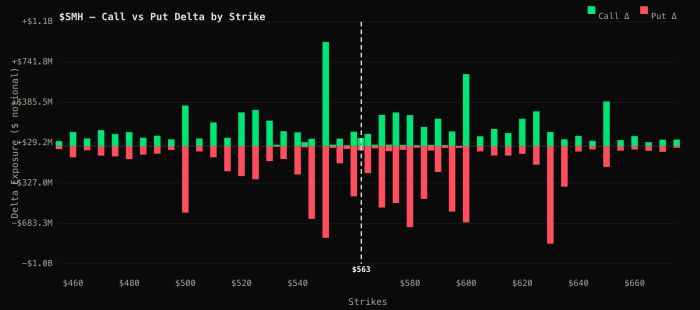
To avoid confusion, the delta chart for the SMH has reverted to the standard convention, with calls positive and puts negative, from the version shown on Tuesday, which attempted to display the exposure from a dealer perspective. There is still a large amount of call exposure above the current spot price that is due to decay, and overall net delta exposure remains positive. So there is a chance that if the SMH breaks the put wall at $560, the decay of the calls, combined with the puts becoming energized, could lead to a further drop in the sector.



Comments
Log in or sign up to join the conversation.