

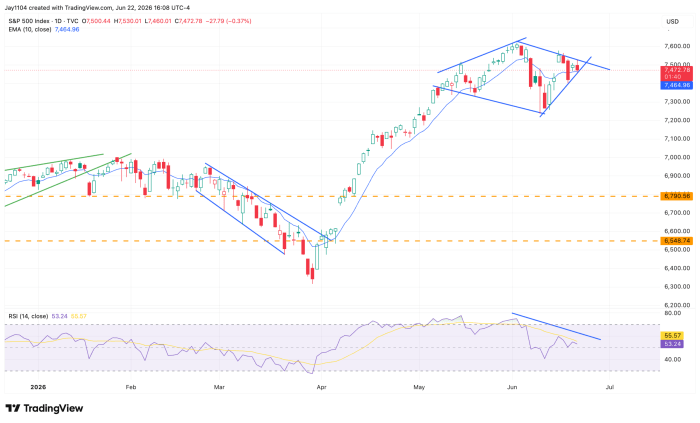
The S&P 500 fell about 40 basis points on the day, with technology stocks leading the decline. If not for the strength in semiconductors, the sell-off could have been much worse.
What is becoming increasingly clear from a technical perspective in the S&P 500 is that the index is consolidating and may be forming a diamond pattern. There appears to have been a widening formation leading into the June 2 peak, followed by the current consolidation phase, which is consistent with a diamond top pattern.
Meanwhile, the falling RSI suggests that momentum has faded significantly over the past several weeks and has yet to recover. That would be viewed as a negative technical signal for the index.
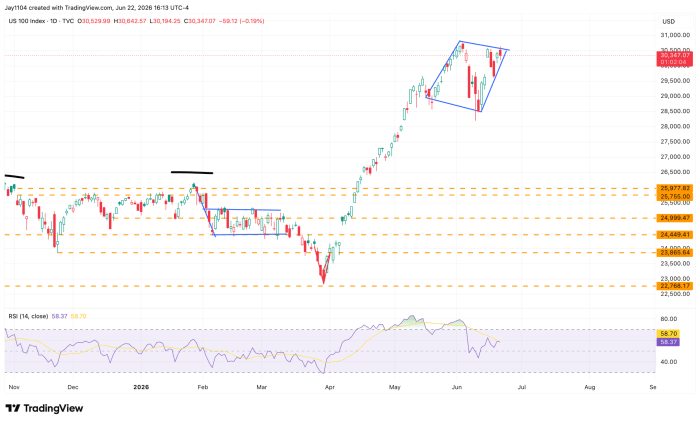
I’m not entirely sure what to call the pattern in the Nasdaq 100 at this point—perhaps a parallelogram or some form of narrowing consolidation. Regardless of the label, both the Nasdaq 100 and the S&P 500 have spent the past several days consolidating. The trading ranges continue to tighten, and the wedge appears to be nearing completion, suggesting that a breakout in either direction could be approaching.
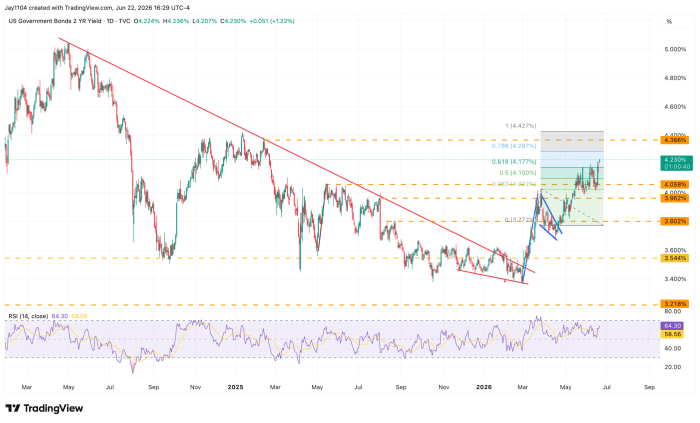
Two-year Treasury yields rose on the day despite falling oil prices, climbing to roughly 4.25%. If the 2-year yield has indeed broken out of the bull pennant highlighted on the chart, the measured move projection would suggest a rise toward 4.4%.
Such a move would likely reinforce the recent tightening in financial conditions and could present an additional headwind for equities.
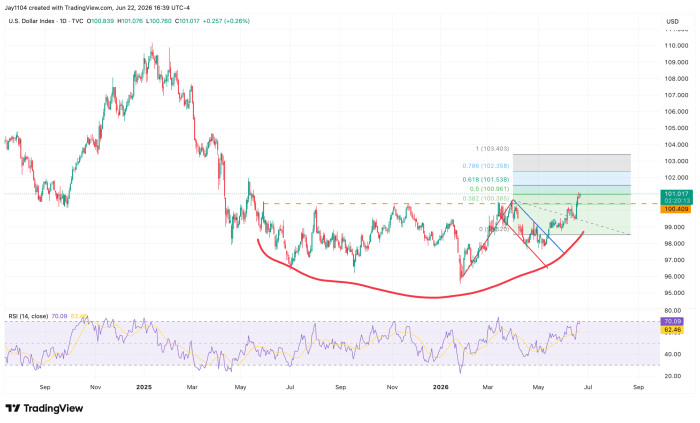
Meanwhile, the Dollar Index continued to strengthen, having broken above resistance at 100.50 last week and now trading north of 101. If the pattern is similar to the bull pennant seen in the 2-year yield, the measured-move projection would suggest the Dollar Index could extend its rally toward 103.40.
A move of that magnitude would likely create additional pressure on risk assets, weigh on commodities, and further tighten financial conditions.
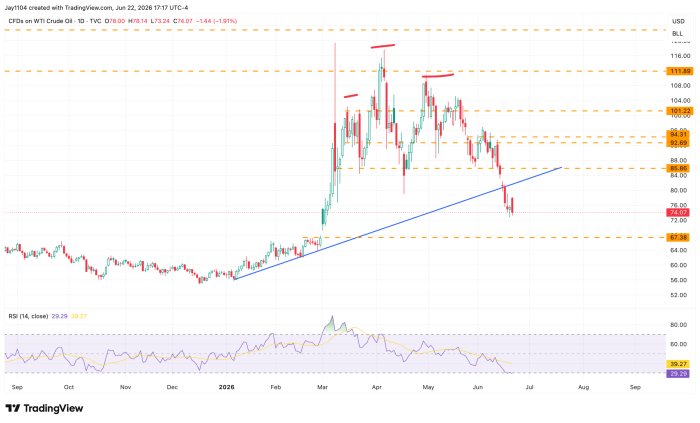
Oil prices fell again and continue to weaken as the market looks beyond tensions in the Middle East. A move down to around $67 would fill the gap created in early March and complete the unwind of the bearish head-and-shoulders pattern that had previously formed.
For now, the technical setup suggests that the recent geopolitical premium in oil prices continues to fade as supply concerns ease and traders refocus on broader macroeconomic factors.
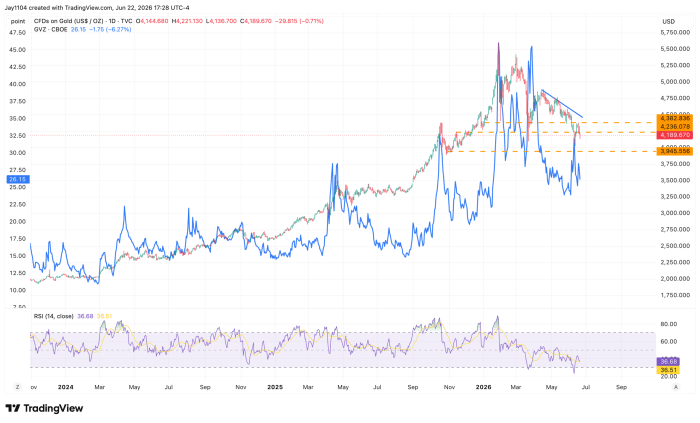
Finally, gold (GLD) prices continue to slip, and that weakness may persist, as implied volatility in gold continues to decline. The feverish sentiment that once surrounded gold continues to fade, and with implied volatility still around 26%, there is room for it to fall significantly further. That suggests the decline in gold prices may be far from over. A stronger dollar certainly won’t help matters.


Comments
Log in or sign up to join the conversation.