
Read Part 1: Some Time Series Data on Mass Shootings
Estimating through end-May, count regression (negative binomial, maximum likelihood):
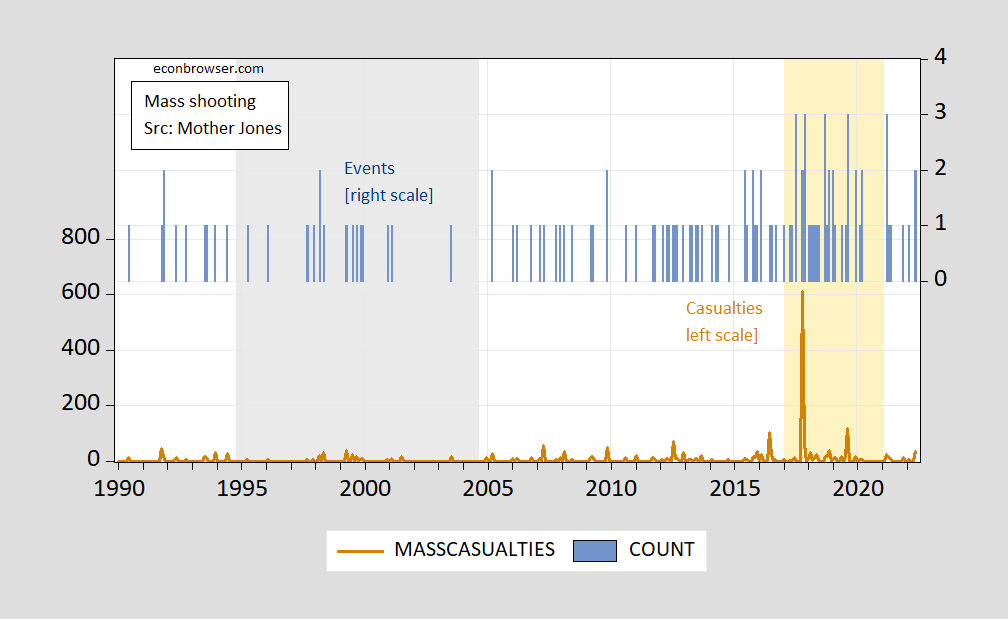
Figure 1: Mass shooting casualties (killed+wounded), left scale (brown), and mass shooting events (blue bar, right scale). Gray shading denotes assault weapons ban. Orange shading denotes Trump administration. Source: Mother Jones database.
We can analyze correlations using regression analysis (negative binomial for casualties, Poisson for events).
casualtiest = –1.72 – 0.72 bant + 1.21 trumpt – 0.14 bident +0.00001popt
Adj-R2 = 0.022, SER = 32.6, NOBS = 389. Bold denotes significance at 10% msl, standard errors corrected for overdispersion (GLM option in EViews).
For number of mass shooting events, count regression (Poisson):
eventst = –5.27 – 0.55 bant + 0.55 trumpt + 0.014 bident +0.00001popt
Adj-R2 = 0.100, SER = 0.565, NOBS = 389. Bold denotes significance at 10% msl, standard errors corrected for overdispersion (GLM option in EViews).
Population for April, May extrapolated using previous year’s worth of population data (in log first differences).


Comments
Log in or sign up to join the conversation.