
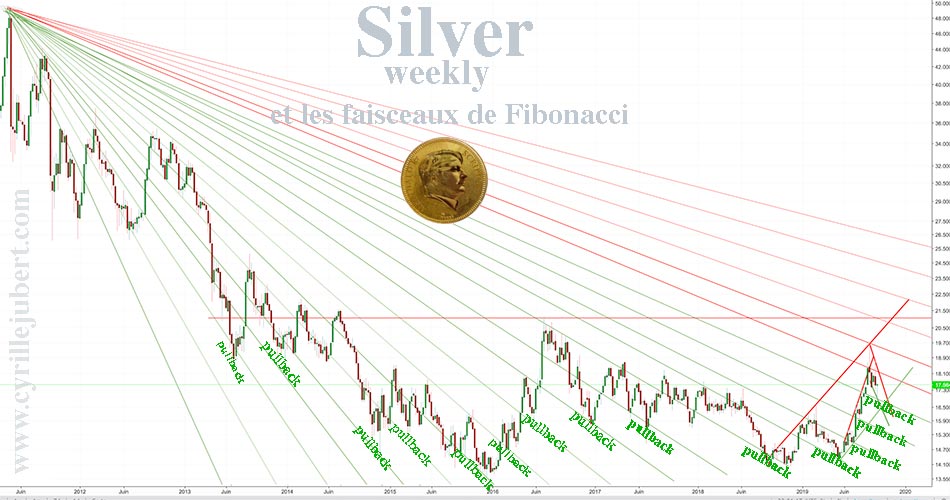
Since 2011, it had been verified, month after month, that the bullion bank’s trading software for silver is based on the Fibonacci’s fan.
Each time that one of this fan coming from the 2011’s high is broken by the price going upwards, silver cannot mount durably if there is not a pull-back on it, to check that this ex-resistance became a support.
The bullions banks have been able to make these pull-backs last for weeks or even months, as was the case in the first half of 2019.
(Click on image to enlarge)
If we take a close look at the last four months, there has been a pull-back on each of the crossed fans and this movement had been done very quickly.
The decline since the high point of September 4 was aimed to make a pull-back on the fan broken up in mid-August.
(Click on image to enlarge)
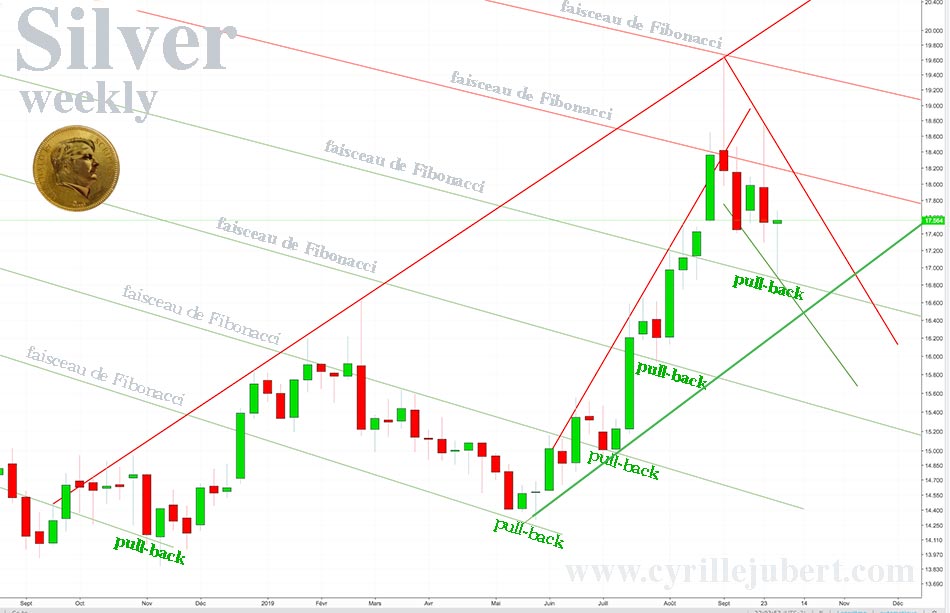
The 50 Months Mobile Average served as resistance for several years, so it is expected to make a pull-back on it. On a monthly basis, this MA50M is at $16.35.
In daily, the MA100D is confused with the support of this leg of rising, in green above. It is around $16.34.
So I would have expected a consolidation at this level, but if it occurs, it could happen in flash-trading without affecting the official London fixing of silver. Clearly, if you wait for this low point to buy physical, you could not benefit of the low price. In the event of a quick drop, prices would return very quickly to $18. When we look at the first week of October’s candlestick, we see that there has been a very powerful force to purchase the lows.
It is very interesting to compare the data of silver in 1972 and those of 2019:
The high point of September 5, 1972, was $1.95 against $19.6 on September 4, 2019. The low point of September 27, 1972, was $1.69 against $16.9 on September 30 and October 1, 2019.
There is a perfect reproduction of prices, almost to the day between 1972 and 2019. The purchasing power of the Dollar has just been divided by TEN.
The target of silver remains $21 an ounce. That price should be reached in the very first days of January. When this $21 level will be broken, there will probably be a short-squeeze, causing a panic rise of a few days, which could lead to $26 around the end of February 2020. After this melt-up, we should attend a pull-back on this level of $21.
Then, the next target will be the $31-34 level of Fibonacci, which is expected to be reached in the middle of the summer of 2020, but this resistance could be difficult to break before the end of the year.
READY FOR A RODEO?
I regularly monitor the graph of SUGAR, because there is some correlation between the moves of sugar and those of silver.
Sugar prices are extremely volatile and amplify movements of oil and precious metals, or conversely speculation against the Dollar.
(Click on image to enlarge)
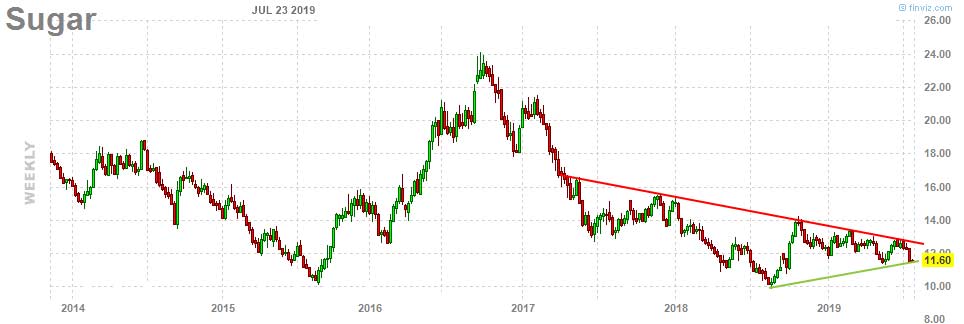
On July 23, I wrote to my subscribers:
"Graphically, the weekly chart have just taken their 3rd support on the base of this triangle. If the support holds, we should have an upwards exit of this triangle before the end of the summer."
This would arrange all the central banks of the planet since the increase in sugar would boost inflation, while the economy is in full deflation.
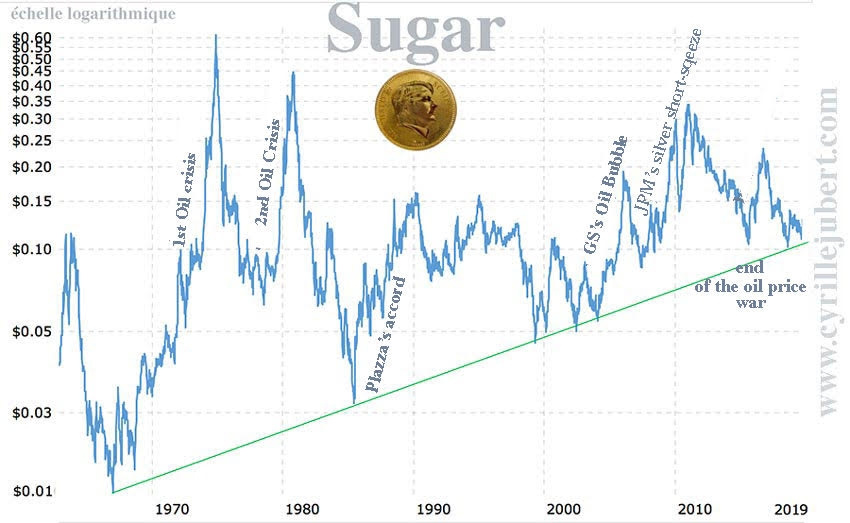
For those who have not seen the movie "Le Sucre" with Depardieu and Jean Carmet, find the tape or watch it in streaming. It's a MUST. He talks about Sugar’s speculative bubble from December 1973 to November 1974... a bubble totally fabricated, very spectacular and very lucrative for those who knew how to ride the rise in the good timing, before to surf the decline.
On January 2, 1967, the low point of sugar was made at $0.01 per pound. The high point of November 18, 1974, was $0.65 per pound. The courses were multiplied by 65.
(Click on image to enlarge)
For those interested in fundamentals, the world sugar market could enter a deficit phase in 2019/20, according to analysts polled by Reuters. According to them, the sugar deficit should reach 1.9 million tonnes in 2019/2020 against a surplus of 2.55 million tonnes in 2018/2019, due to the fall in the Indian sugar harvest. With the return to a deficit situation, world sugar prices should resume some colors by the end of the year. According to the median forecast of experts, the price of raw sugar (in New York) is expected to increase by 15% to 14.6 cents per pound, while the world price of white sugar in London should increase by 17% to $391.50 per tonne, compared to their closing price last Friday.
If we look beyond these data, the Dollar Index is at a peak against all other currencies and must fall not to trigger a global debt crisis, on the one hand, and precious metals, on the other hand, entered a bull market all currencies combined. All conditions are met for a sharp risen sugar, and perhaps a new huge speculative bubble.
On August 20, 2019, the low point was made at $0.10 per pound. Note that as for the money, its price has been multiplied exactly by 10 compared to the 70s.
On the futures of SUGAR #11, the contract unit is 112,000 pounds (source ICE) the low point was made at $10.
So if a speculative bubble similar to that of 74 develops, the price of arrival could approach $650 on these contracts. (pdf)
Obviously, this is by no means an encouragement to take financial risks on a professional market. Everyone invests at their own risk and remains solely responsible for their choices.
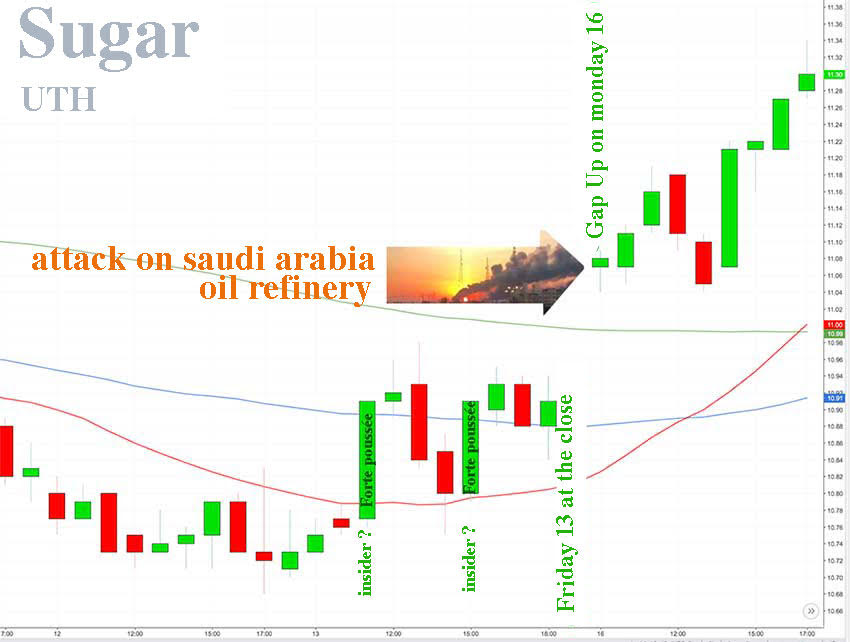
INSIDER TRADING?
Friday, September 13, there is a big purchase at 11 am, which broke the MM20H, then pull-back, big new purchase at 15:00 that breaks the MM50H... and pull-back at the close.
Saturday, September 14, attack oil infrastructure of Saudi Arabia, which may suggest that oil will miss, so rise sharply...
Monday, September 16, the sugar opens very strongly upwards.
(Click on image to enlarge)
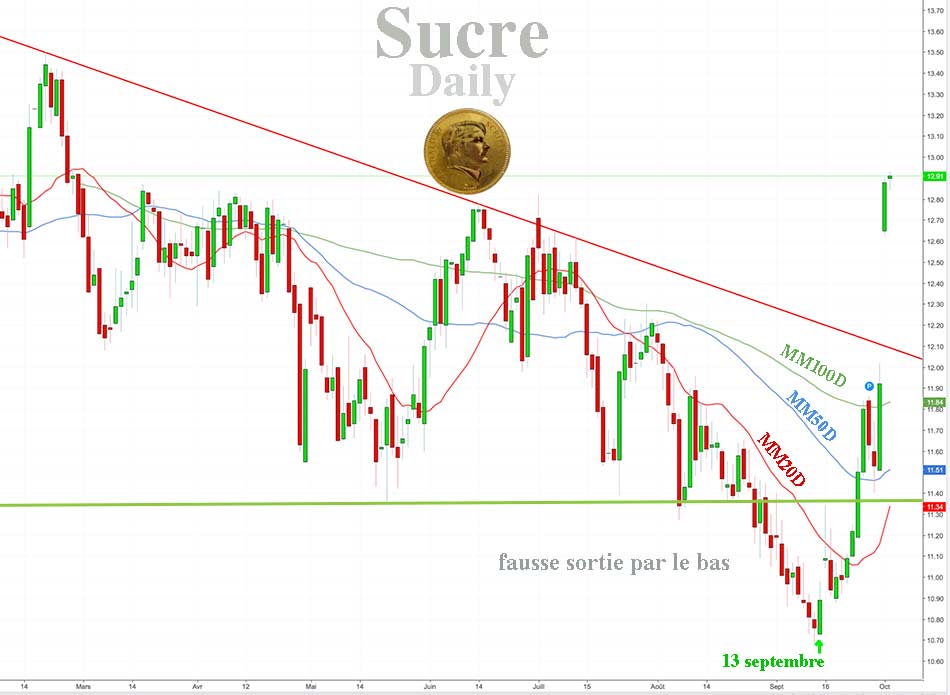
SUGAR HAS JUST STARTED A BULLISH RALLY
After a quick pull-back on the MA50D, the sugar flies up 10% in two days.
Once the pull-back on the resistance will be done, the first short-term target is $14.65 and probably $15.16 the MA200M...
If the sugar rally follows the silver rally until the end of 2021, there is a lot of room upwards for improvement.
(Click on image to enlarge)
Comments
Log in or sign up to join the conversation.