


Silver (XAG/USD) trades virtually unchanged on Tuesday around $70.00 after reclaiming its 200-day Simple Moving Average (SMA), as traders await the Federal Reserve's (Fed) monetary policy announcement before placing large directional bets.
The white metal is struggling to capitalize on the weaker US Dollar (USD) and lower Oil prices, which have come under pressure after the United States and Iran reached a framework agreement over the weekend.
Since the war began, Silver has traded more like an interest rate-sensitive asset than a traditional safe haven. The war-driven energy shock prompted traders to scale back expectations for Fed rate cuts and even price in the possibility of a rate hike later this year, which pushed XAG/USD down more than 30% from its pre-war levels.
However, following the announcement of the US-Iran agreement, buyers have gradually returned to the market as falling Oil prices ease inflation concerns.
Even so, traders appear reluctant to chase prices higher, with the Fed's monetary policy announcement likely to act as the next major catalyst in determining whether Silver can extend its recovery or surrender recent gains.
Technical analysis:
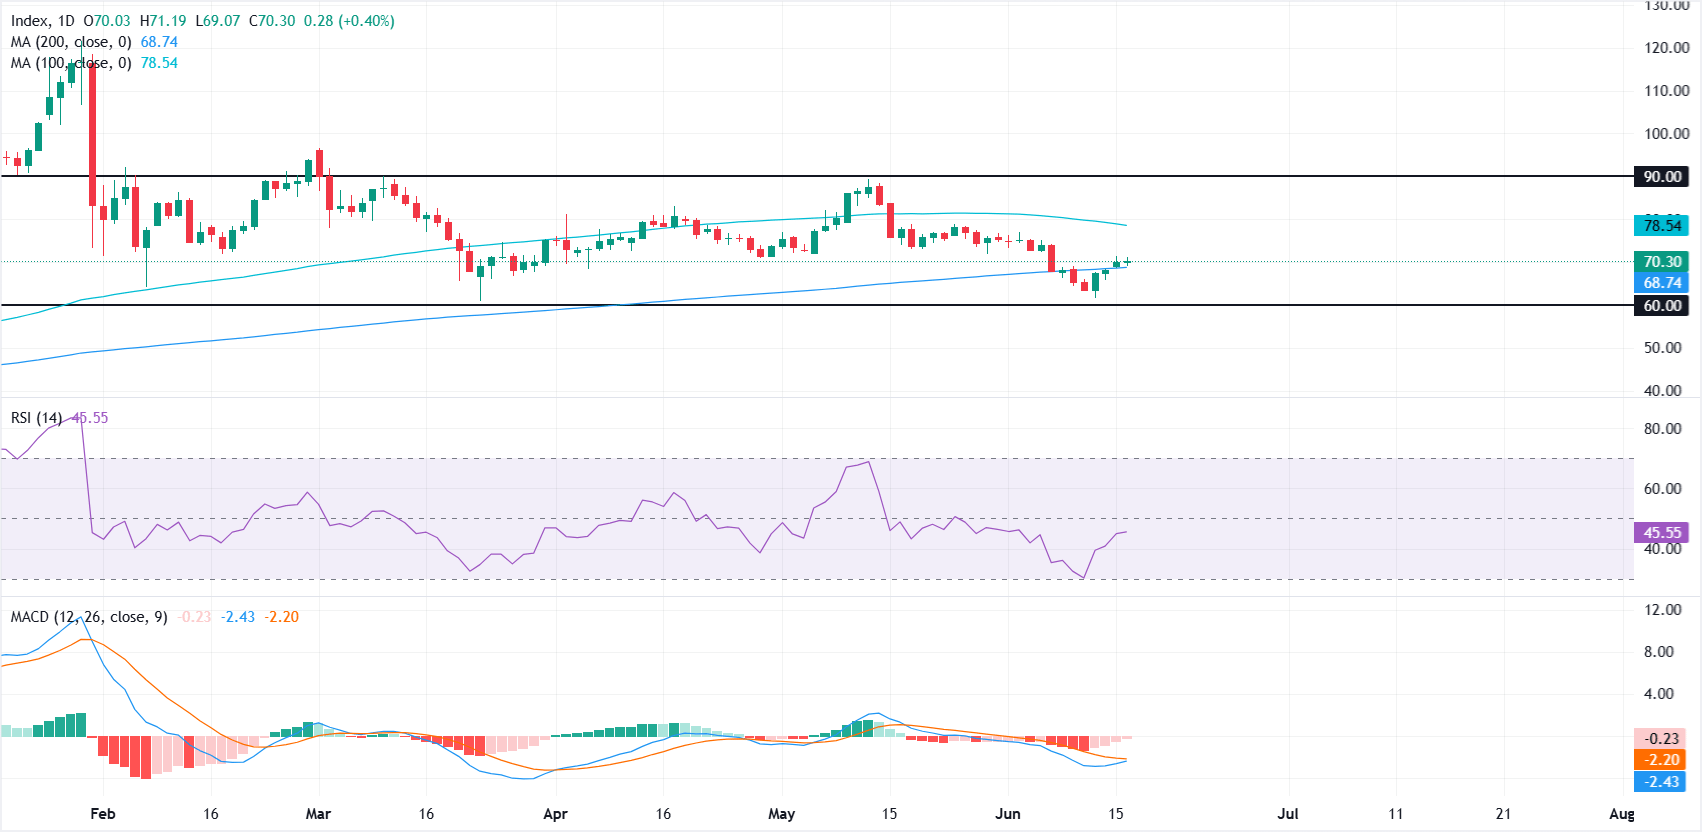
In the daily chart, XAG/USD holds a bearish near-term bias as price sits below the 100-day Simple Moving Average (SMA) at $78.54 while only marginally above the 200-day SMA at $68.74. This configuration suggests the broader trend has softened, with the 200-day SMA offering tentative medium-term support and the 100-day SMA now acting as an overhead cap.
Momentum indicators are showing early signs of stabilization. The Relative Strength Index (RSI) has recovered to 45.49 from near-oversold levels, suggesting selling pressure is easing. Meanwhile, the Moving Average Convergence Divergence (MACD) remains in negative territory, but the fading red histogram indicates bearish momentum is beginning to weaken.
On the downside, if the 200-day SMA fails to provide support, a sustained break below it could expose the next major support zone near $60.00. On the topside, recovery attempts are likely to face initial resistance at the 100-day SMA around $78.54. A daily close above that level would ease the bearish bias and open the door for a move toward the next resistance area near $90.00.



Comments
Log in or sign up to join the conversation.