


West Texas Intermediate (WTI) – the benchmark US Crude Oil price – attracts some sellers during the Asian session on Friday, snapping a two-day winning streak and stalling the previous day's recovery from the vicinity of a nearly four-week low. The black liquid currently trades near $91.50, down 0.45% for the day, though the downside seems limited amid the risk of a further escalation of tensions in the Middle East.
In the latest developments, the Wall Street Journal reported that the Pentagon may soon send a third aircraft carrier strike group and 10,000 sailors and Marines to the Persian Gulf. Separately, Iran’s Persian Gulf Strait Authority (PGSA) said several tankers were attacked in the Strait of Hormuz in recent days. Adding to this, US President Donald Trump said on Wednesday that he would decide very soon whether to blow up Iran and added that the war will end very soon one way or the other. This keeps the geopolitical risk premium firmly in play and should act as a tailwind for crude oil prices.
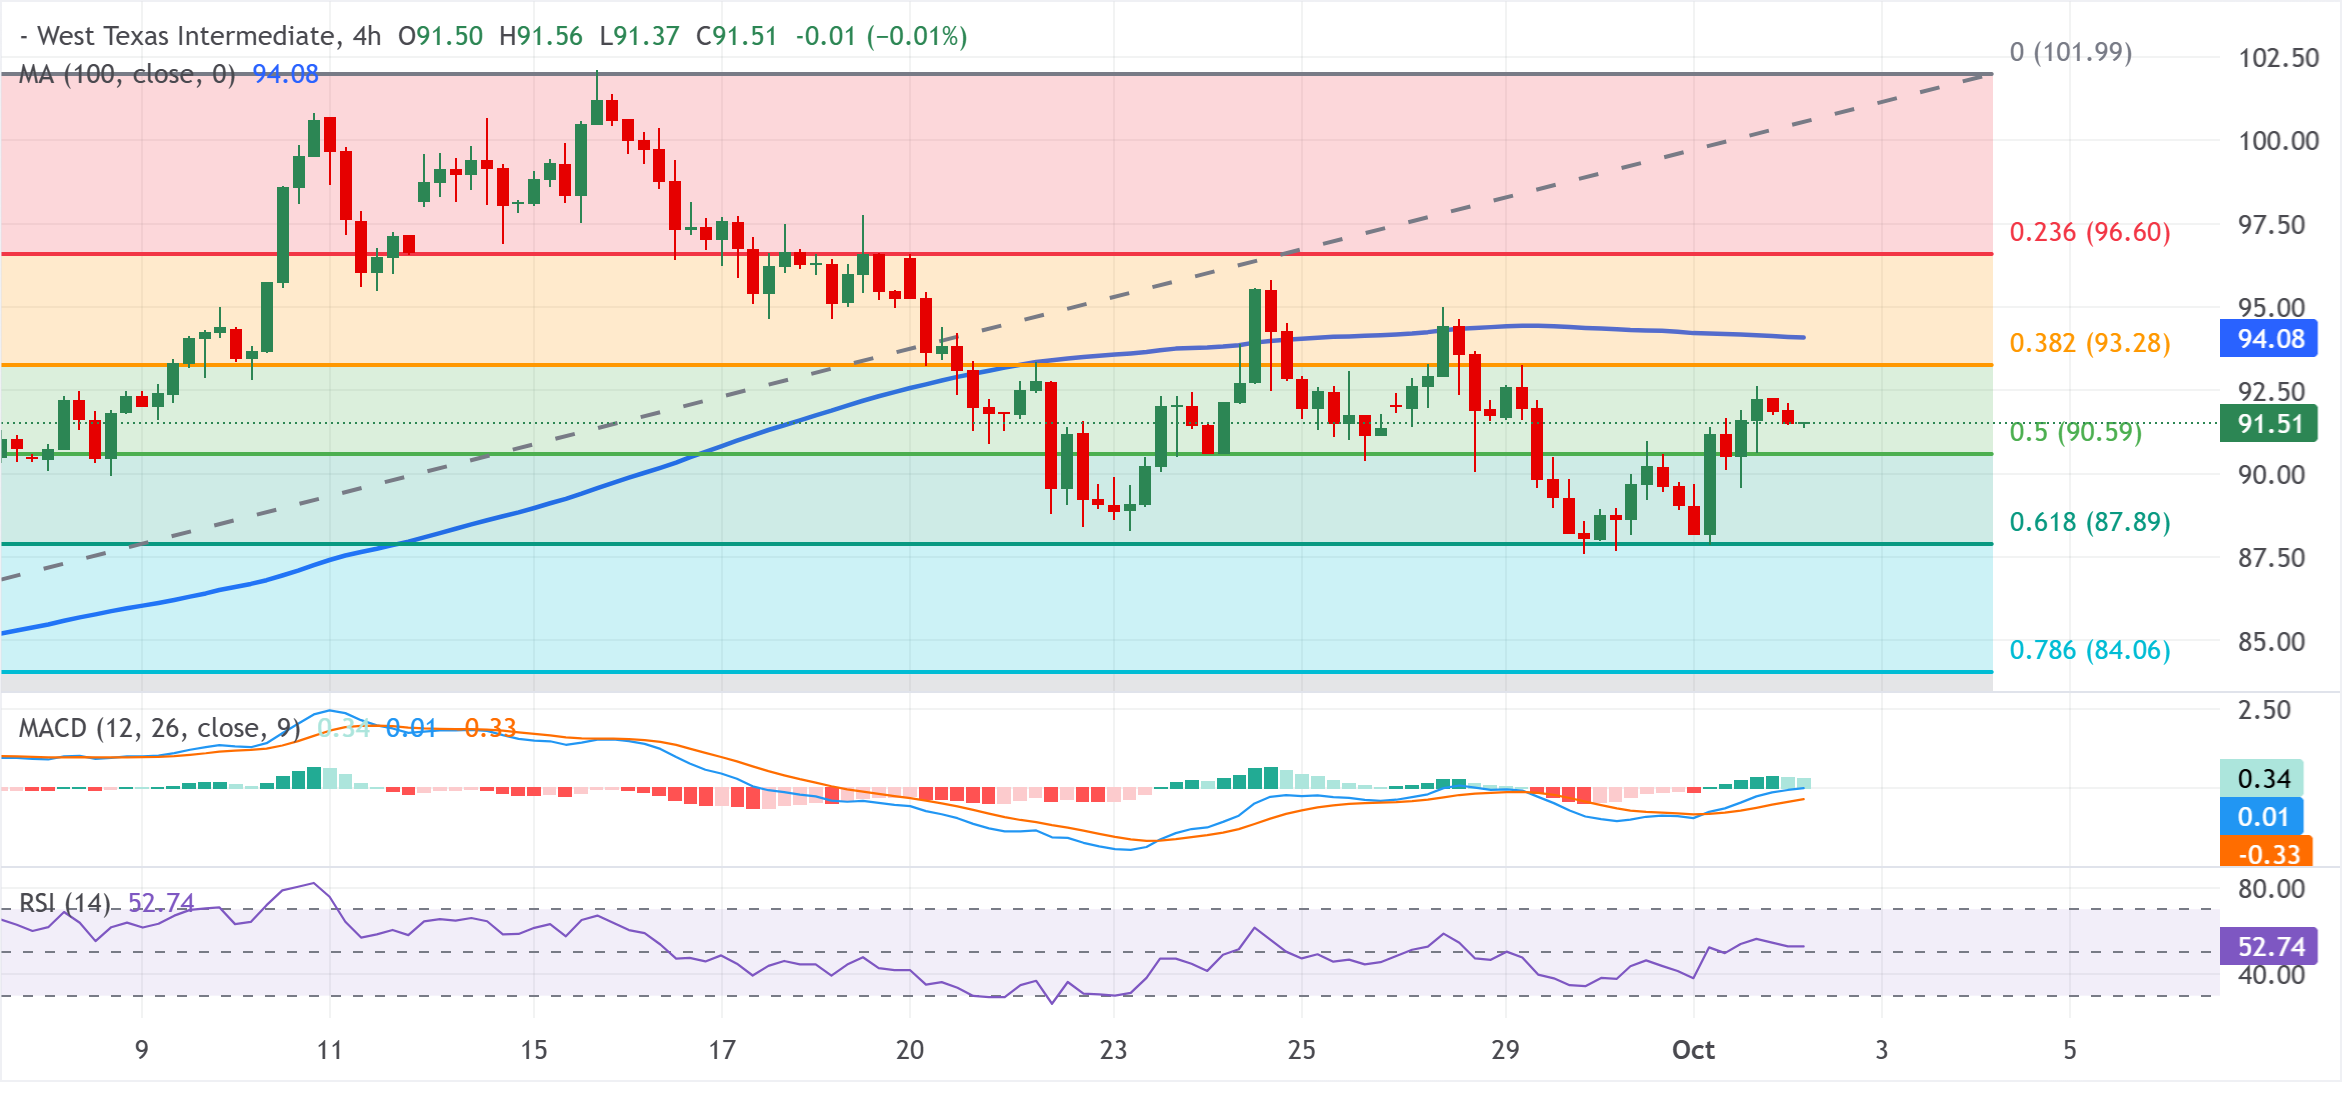
From a technical perspective, the black liquid remains capped by the long-term trend structure, with the 100-period Simple Moving Average (SMA) on the 4-hour chart at $94.08 and the 38.2% Fibonacci retracement at $93.28 sitting overhead. This configuration keeps the near-term bias bearish despite a constructive tone in momentum indicators. In fact, the Relative Strength Index (RSI) holds in neutral-positive territory near 53, and the Moving Average Convergence Divergence (MACD) stays above zero with a positive histogram, hinting at only a modest recovery attempt within a broader corrective phase.
Meanwhile, initial support emerges at the 50.0% retracement at $90.59, followed by the 61.8% Fibo. retracement at $87.89, which together define a nearby demand zone before deeper levels at $84.06 and $79.18. On the topside, immediate resistance is seen at the 38.2% retracement at $93.28, ahead of the 100-period SMA at $94.08. A more significant bullish extension would require a break of the 23.6% retracement at $96.60 and ultimately the structural high near $101.99 to challenge the prevailing short-term bearish bias.
WTI 4-hour chart



Comments
Log in or sign up to join the conversation.