

When the Bank of Canada announced its rate hike on July 12th, many analysts started to ring alarm bells about its impact on the highly indebted Canadian consumer. Articles appeared showing the impact on mortgage and other consumer carrying costs, raising the spectre of a major correction in housing prices. While the policy rate increase was a mere 25pbs, from 50bps to 75bps, some analysts stated it was just the beginning of a tightening cycle as the credit markets return to “normal”. Too much is made of the impact of the rate hike and the prospects of a steady tightening cycle. Quoting Shakespeare,” the lady doth protest too much, methinks”.
Focusing on the extent of indebtedness, without a commensurate measure of assets, leaves one with a false conclusion regarding the impact of rate changes on households. A recent study by the Fraser Institute[1]—a conservative Canadian think tank --- drives this point home.
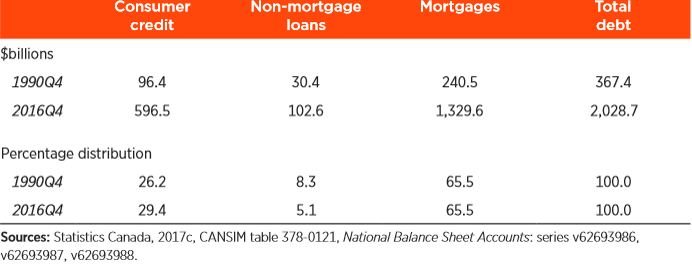
Figure 1 clearly shows that mortgages make up 66% of all household debt, a finding that is not unexpected given the strength in the housing market in the major Canadian cities. Over the 26-year period starting in 1990, mortgage debt as a per cent of total debt has remained constant, while there has been a slight increase in ratio of consumer credit to total debt from 26% to 29%, again not a significant change over time.
Figure 1 Distribution of Debt
Source: Fraser Institute
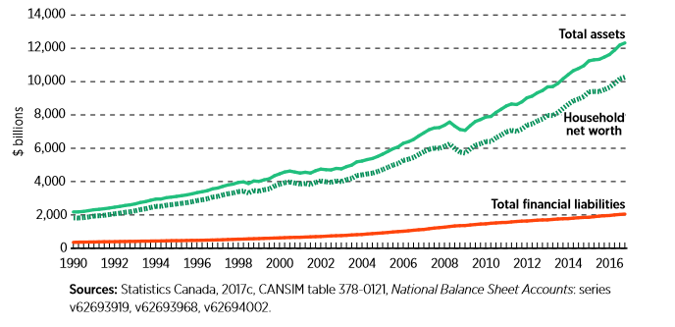
While Canadian households have taken on more debt over time, they have used this debt to finance assets—real estate and financial assets—that are appreciating over time, causing their net worth to grow (Figure 2). The dramatic growth in total assets compared to total liabilities provides comfort regarding the ability of Canadians to adjust to higher interest rates. More importantly, total household net worth rose from $1.8 trillion in 1990 to $10.3 trillion; as a result, the ratio of net worth to GDP nearly doubled from 265% to 500%. Canadians have been accumulating wealth at a relatively fast pace over the past quarter century.
Figure 2 Household Assets, Financial Liabilities and Net Worth, Canada
Source: Fraser Institute
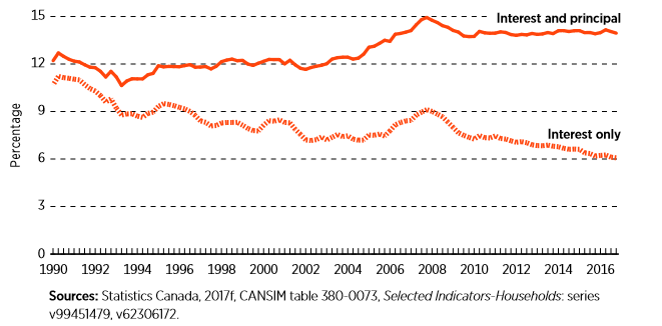
The ability to acquire and finance higher levels of debt is clearly a function of the falling interest rates, starting in 1990 and especially since 2008. Figure 3 measures interest and principal costs as a share of income. The huge drop in interest rates results in interest costs actually falling in percentage terms. In other words, the debt levels today are much more easily serviced than the debt levels in the 1990s and in the decade prior to 2008.
Figure 3 Household Debt-to-Service Ratios 1990-2016
Source: Fraser Institute
In sum, interest rates continue to remain low, allowing the Canadian economy to perform reasonably well. At the same time, low rates allow Canadians to amass greater wealth. The real issue is not the debt levels, per se, but whether that debt can be managed. Even if interest rates move up another 25bp or 50pbs this poses no real threat to the household sector’s ability to service its debt. For the Bank of Canada to take such steps, there would have to ample proof that the economy is growing rapidly. Faster growth would only make servicing the debt easier.
[1] Fraser Institute, “Household Debt and Government Debt in Canada”, Livio Di Matteo, 2017.



Comments
Log in or sign up to join the conversation.