

SPX Monitoring purposes; Long SPX on 4/8/26 at 6782.81.
Our gain 1/1/24 to 12/31/24 = 29.28%; SPX gain 23.67%
Our Gain 1/1/23 to 12/31/23 SPX= 28.12%; SPX gain 23.38%
Monitoring purposes GOLD: Long GDX at 75.76; 9/29/25
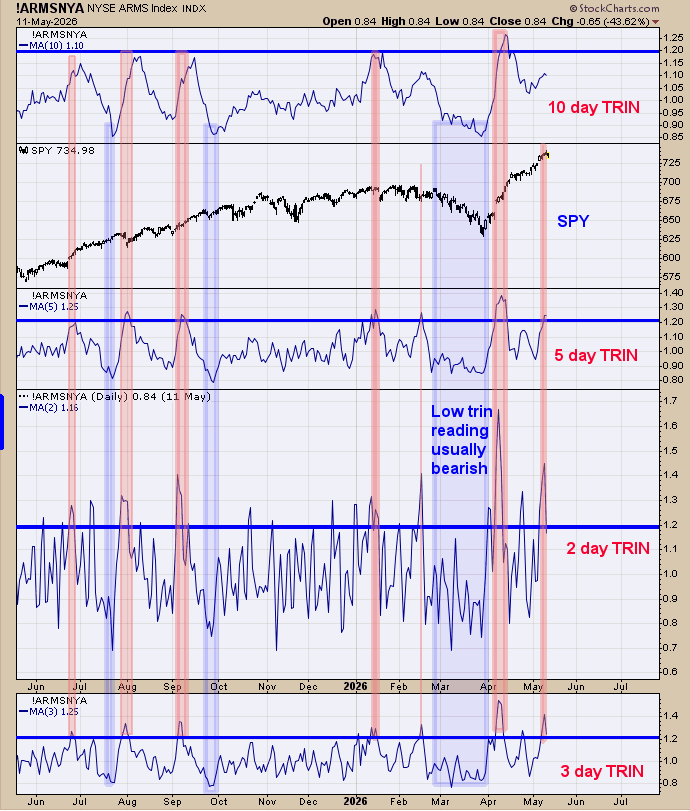
Panic only forms near lows in the market. When the TRIN closes near 1.20 and higher shows there is panic in the market and suggests a low is near. The bottom window is the 3 day average for the TRIN closes, next higher window is the 2 day average; next higher window is the 5 day average and top window is the 10 day average of the TRIN. We shaded in pink when the TRIN averages reached 1.20 and higher. Currently we have the 2, 3 and 5 averages of the TRIN closing above 1.20 suggests short term panic and a bullish sign. Could be a minor consolidation here but larger trend remains bullish. Staying long the SPX (SPY).
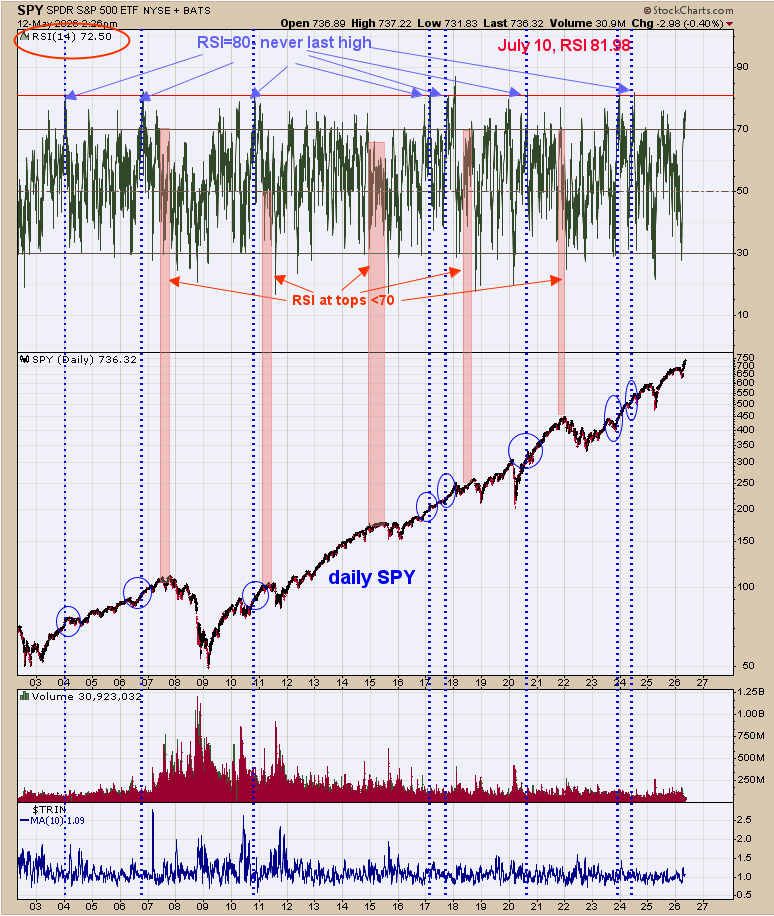
The RSI hitting 80 is still a possibility; reached 76 yesterday. Yesterday’s commentary still applies, “Top window is the RSI 14 period going back to 2002. We noted the times when the RSI (14) reached 80 with blue dotted lines. An RSI of 80 suggests the market has strong momentum and never the last high in the market. The RSI reached 80, eight times since 2002 (once ever 3 years) and is a rare occurrence. Current RSI reading stands at 76.52, only 3 ½ points away of reaching 80. The reason we pointed out the RSI reading near 80 is that it has marked the half way point of the move up in the past. If indeed the RSI does reach 80 in the near future than we can project a price target to where the market is heading on this run. We will keep watch on this chart going forward.”
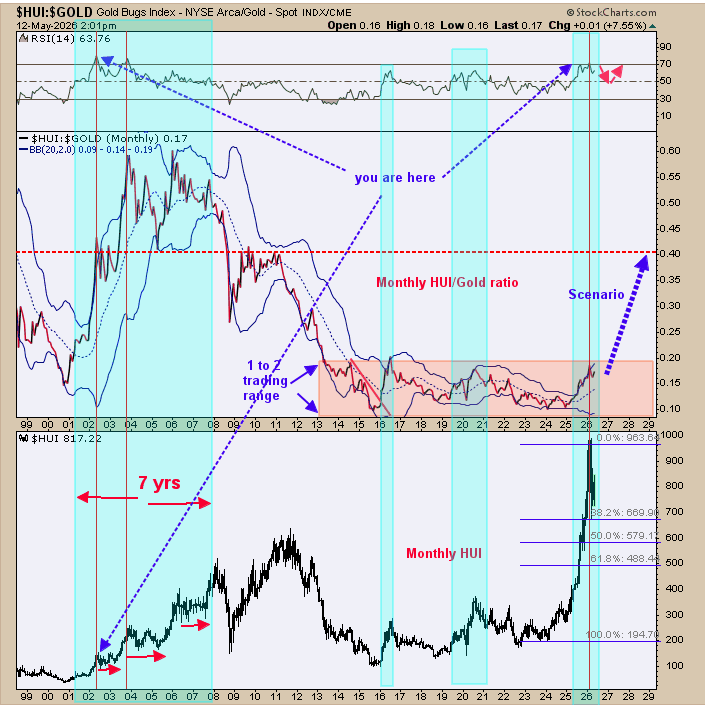
Above is a trend follow indicator; which is the monthly RSI for the HUI/Gold ratio. When the monthly RSI of the HUI/Gold ratio is above 50, HUI is considered in an uptrend and when below 50 a downtrend. We noted in shaded green when the RSI for the HUI/Gold ratio is above 50. This indicator gave a bullish signal back in early 2025 and remains on a buy signal. As long as the monthly RSI for the HUI/Gold ratio holds above 50 the longer term uptrend in HUI is intact. Long GDX 9/29/25 at 75.76.

Comments
Log in or sign up to join the conversation.