

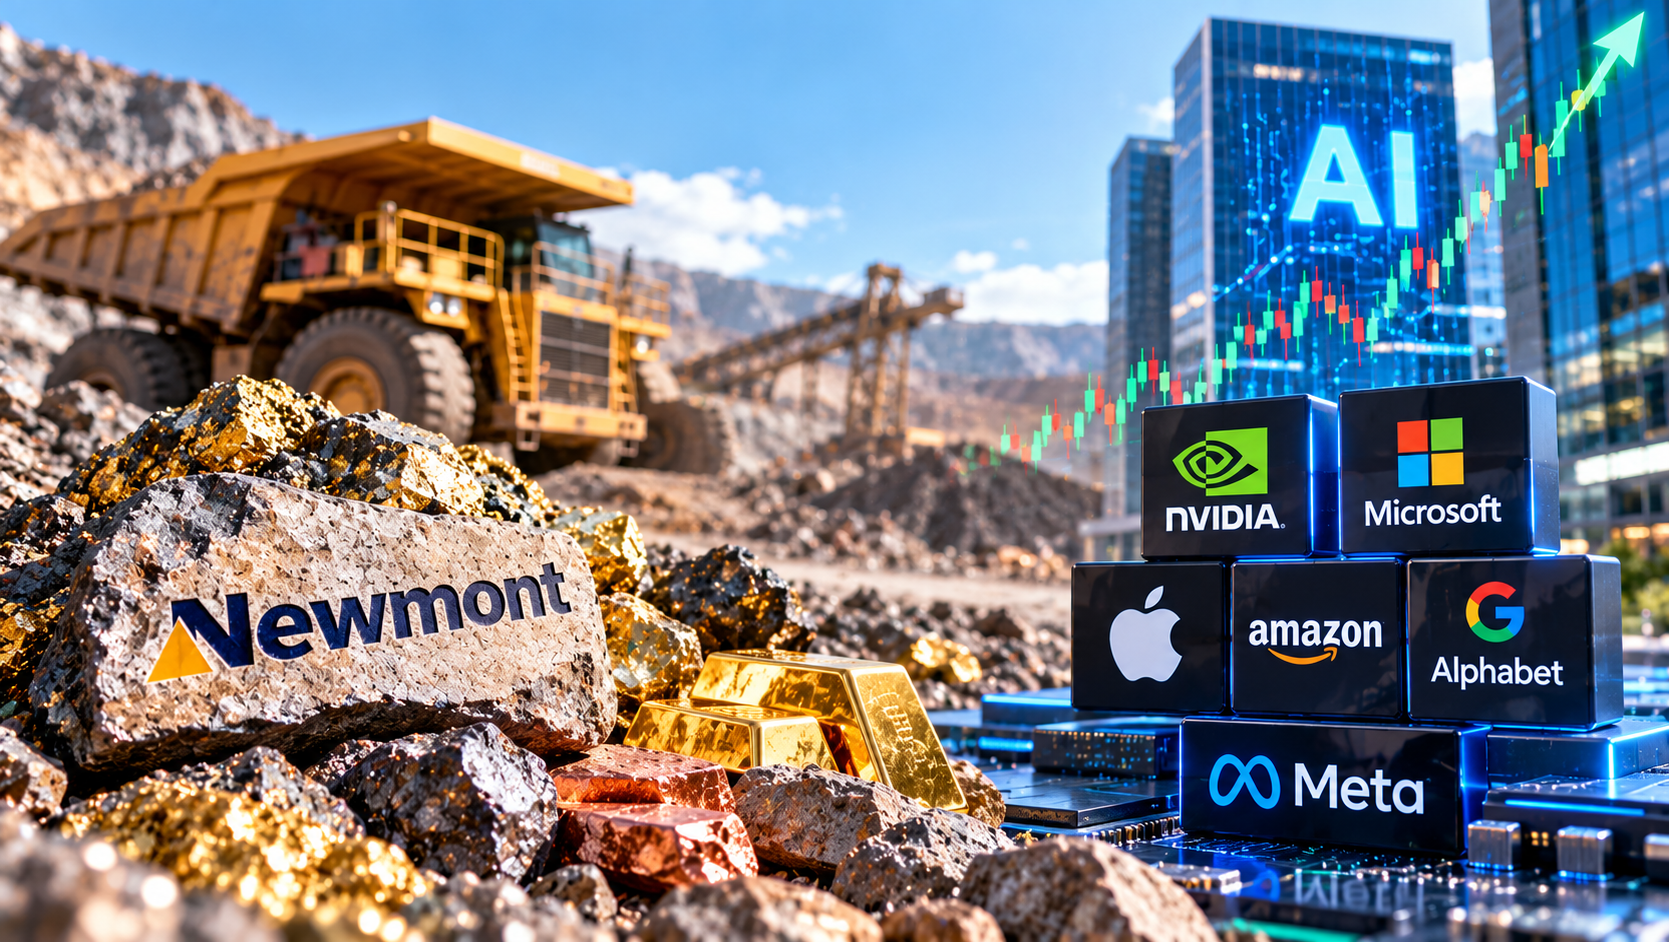
Wall Street has one trade right now.
AI.
There are 41 stocks in the S&P 500 that J.P. Morgan tags as AI-related now make up 49% of the entire index…
That’s a bigger share than tech held at the 2000 peak (41%), bigger than Japan’s share of world stocks in 1988 (44%), and bigger than the Nifty Fifty in 1972 (40%).
Only the railroads in 1881 ran hotter, at 63% concentration.
Here’s how today stacks up against every major bubble of the last 150 years:
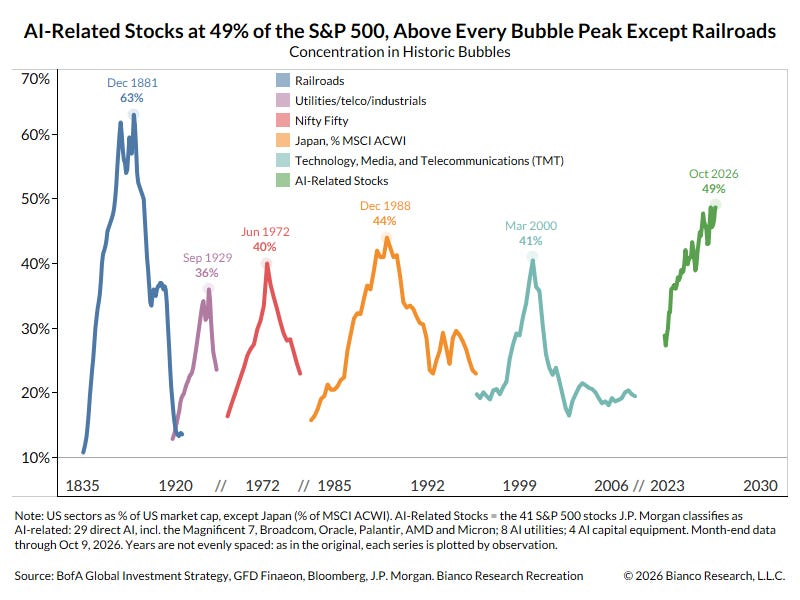
Every other line on that chart peaks and rolls back down.
Now look at who’s really making the moola.
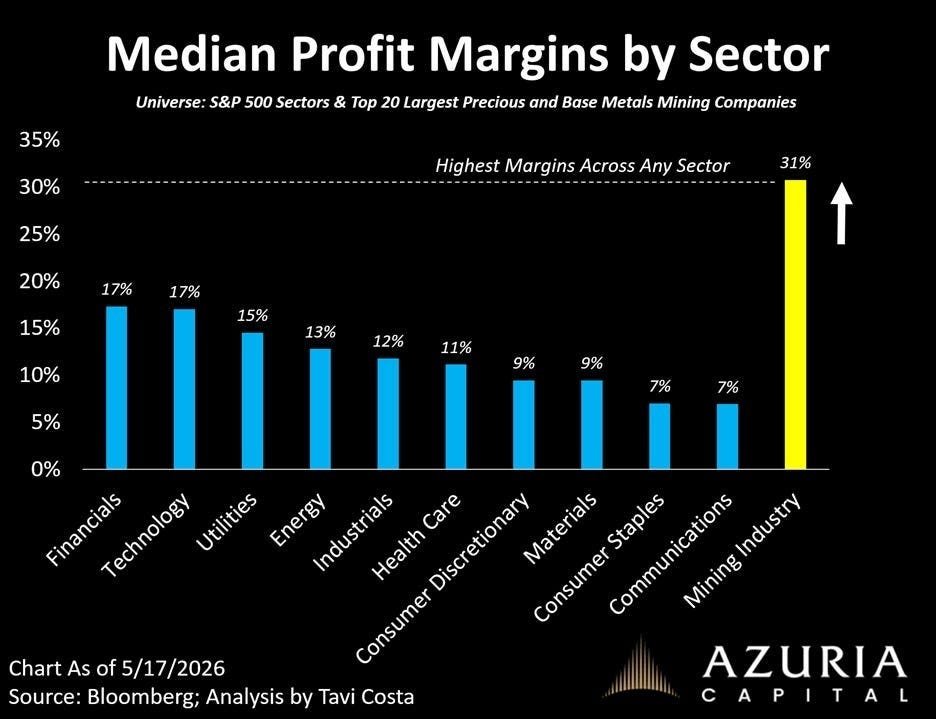
Rank the sectors of the market by median profit margin, and mining tops the list at 31%. Tech and financials tie for second at 17%.
Newmont's (NEM) third-quarter release, out October 22, shows what that looks like on the ground. The company turned $2.8 billion of operating cash flow into $1.9 billion of free cash flow in the quarter…
And $7.3 billion over the first nine months of the year, on an average gold price of $4,317 an ounce.
So miners earn nearly twice the margin of tech…
And they cost less.
Here’s the free cash flow each group generates as a share of its market value, miners minus tech:
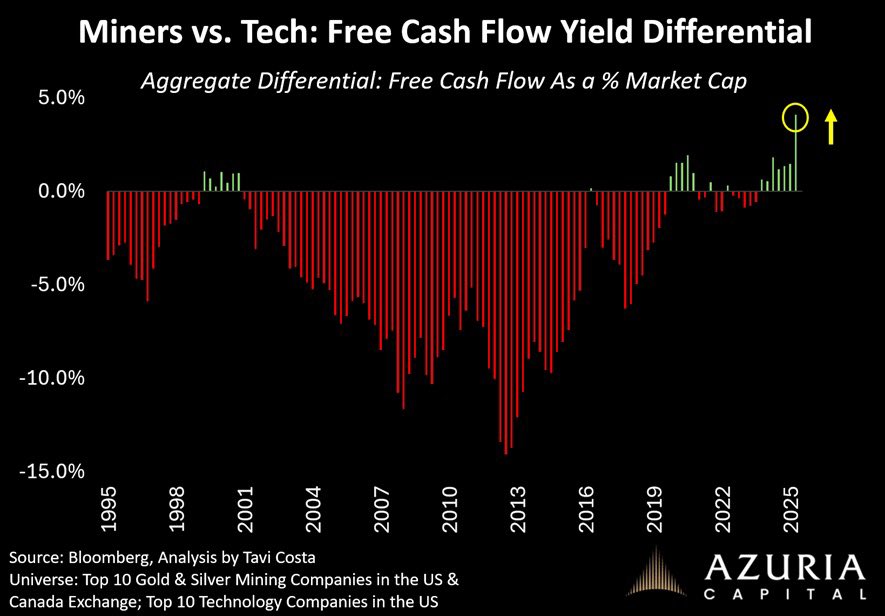
For most of the last 30 years, the ratio sat deep in the red. Around 2013, investors paid so much more for tech as QE pushed more liquidity into the stock market.
Now it’s positive, and the widest on record. By my count, it still stood at +3.6 points on October 26.
In plain terms, a dollar in the big gold and silver miners buys more cash flow than a dollar in the big tech names. Yet the money still piles into AI.
When the madness of the crowds finally dissipates, it has to go somewhere…
The miners already hold the cash.
Comments
Log in or sign up to join the conversation.