


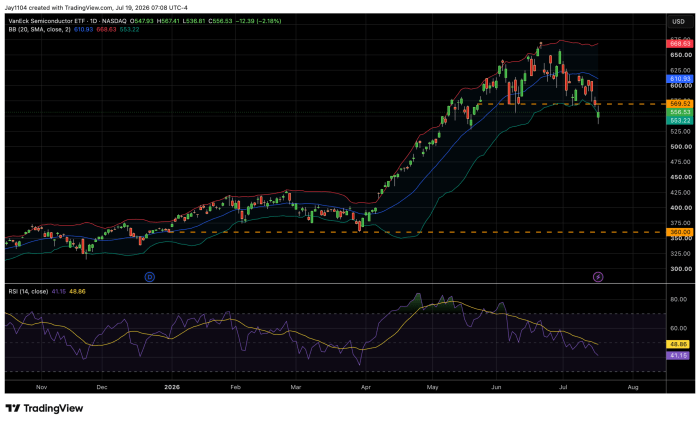
The S&P 500 fell about 1% on Friday as the technology sector declined, led by a roughly 2% drop in semiconductor stocks. Semiconductor stocks are approaching their lower Bollinger Band, but their RSI is only around 41 and continues to trend lower, suggesting they are not yet oversold. As a result, the group could continue to decline this week.
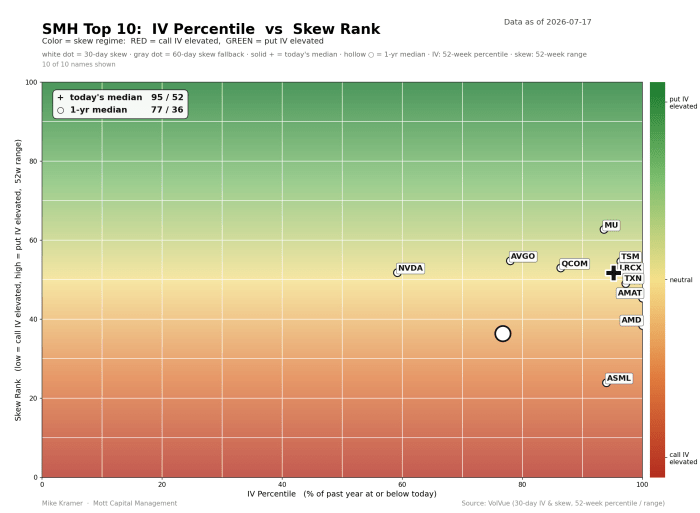
One thing that stands out is the shift in indicators such as implied volatility and skew. Implied volatility remains very high for the group, but the skew has shifted from an extremely bullish positioning to a more neutral stance. The group’s bullish momentum appears to have become more balanced, which is probably a healthy sign that the feverish sentiment and momentum chasing seen in May and June have faded.
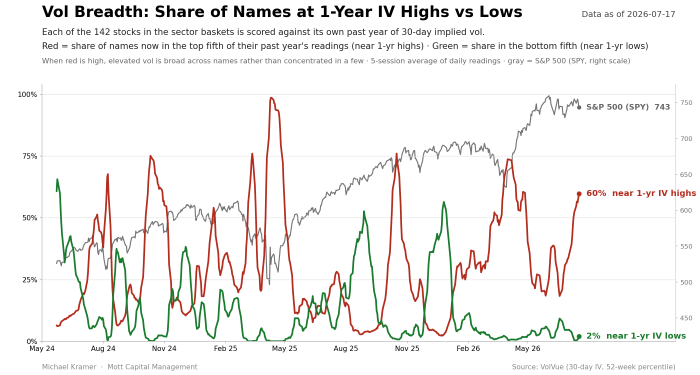
Still, implied volatility in individual stocks remains very high. Of the 142 stocks I track daily—representing the largest companies in the S&P 500—60% have implied volatility near their 52-week highs, compared with only 2% near their 52-week lows. This is certainly not the highest level since May 2024, but historically, volatility breadth this elevated has tended to be followed by a pullback in the S&P 500. July 2024 stands out on the chart below as a similar period: volatility breadth initially rose alongside the index, but the relationship eventually reversed, with breadth continuing to rise as the index fell.
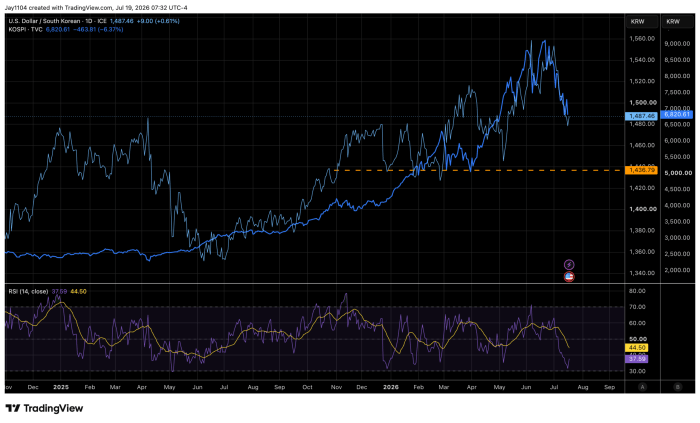
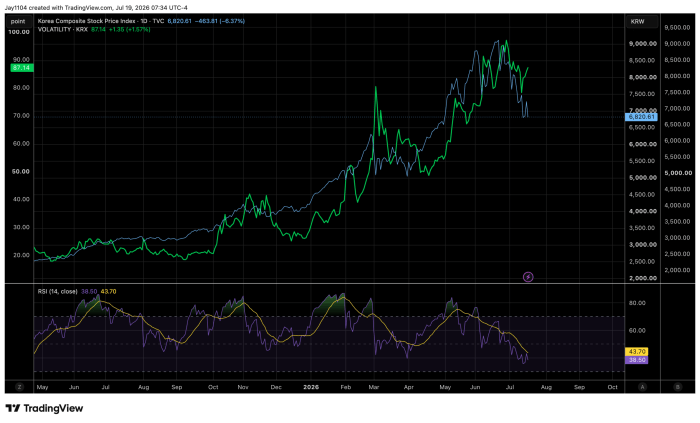
Meanwhile, South Korea’s market was closed on Friday and will reopen on Monday. The Bank of Korea raised interest rates by 25 basis points on July 15, and the market expects another increase before year-end. This has pushed USD/KRW lower, indicating that the won has strengthened against the dollar. The won’s weakness over the past few months appears to have been closely tied to movements in the KOSPI, although whether that relationship will persist remains to be seen. Fundamentally, a weaker won benefits Korean exporters, so further strengthening could weigh on the market their.
On top of that, implied volatility in South Korea has been rising alongside the equity market, generally signaling that the rally is being driven by momentum chasing—rarely a healthy sign.
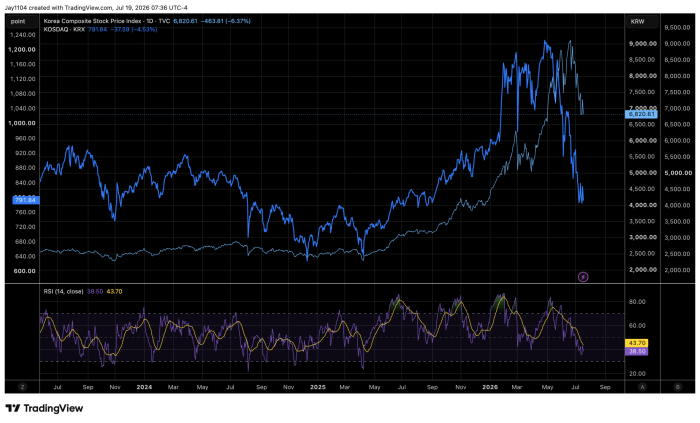
The less-followed KOSDAQ has been crushed in recent weeks, giving back all its gains since September 2025. Because it can lead the KOSPI, its weakness does not bode well for either the KOSPI or the semiconductor sector.
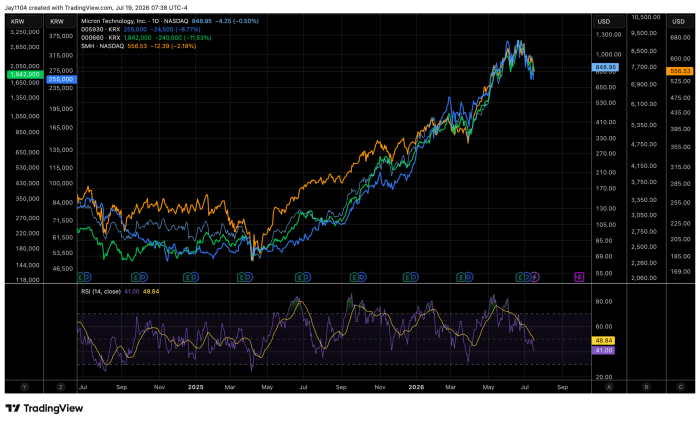
There has been virtually no difference between semiconductor stocks listed in South Korea and those listed in the U.S.; Micron (MU), SK Hynix, Samsung, and the SMH have all traded in much the same way.
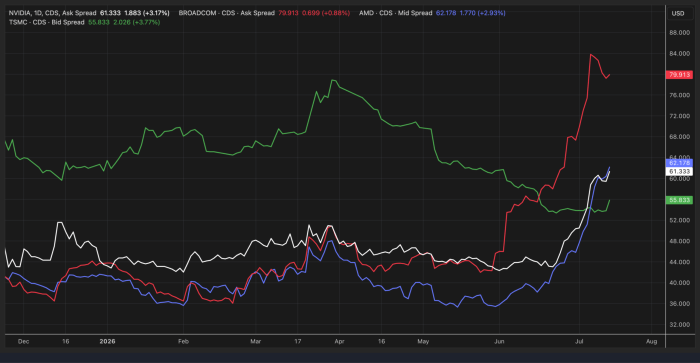
For the most part, their risk profiles are also rising, at least according to the CDS market.


Comments
Log in or sign up to join the conversation.