


The S&P 500 finished the day flat, while the Nasdaq gained around 80 bps. It is hard to say that today was much different from what we have seen in recent weeks.
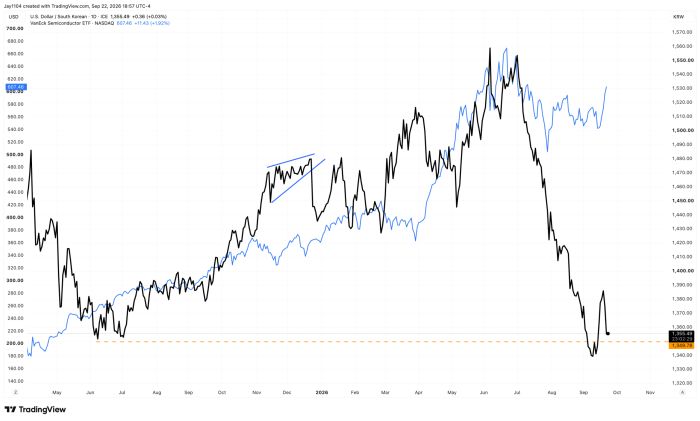
One thing that stands out regarding the SMH is that USD/KRW had been rising over the past few days before taking a leg lower today. At the very least, the relationship between the two still seems intact, although it may operate with a lag. If USD/KRW begins to fall again in the days ahead, then the recent rally in the SMH could begin to fade.
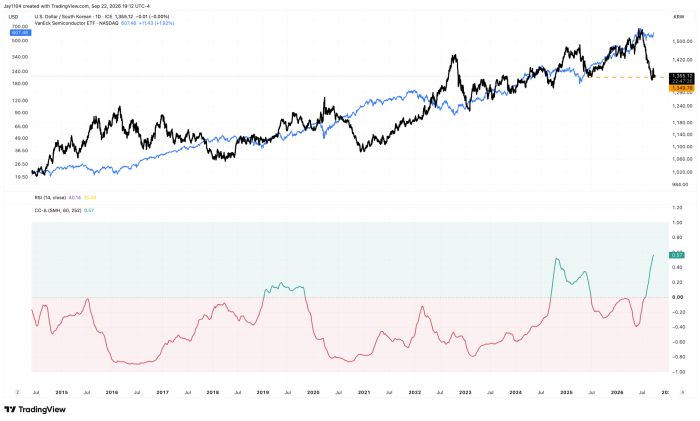
The correlation between USD/KRW and the SMH has been strengthening since 2023, with the current regime lasting longer and showing a stronger relationship than the brief periods seen in the past. This would suggest that if USD/KRW continues to strengthen (fall) from here—and we certainly can’t rule that out—it could have important implications for the semiconductor sector.
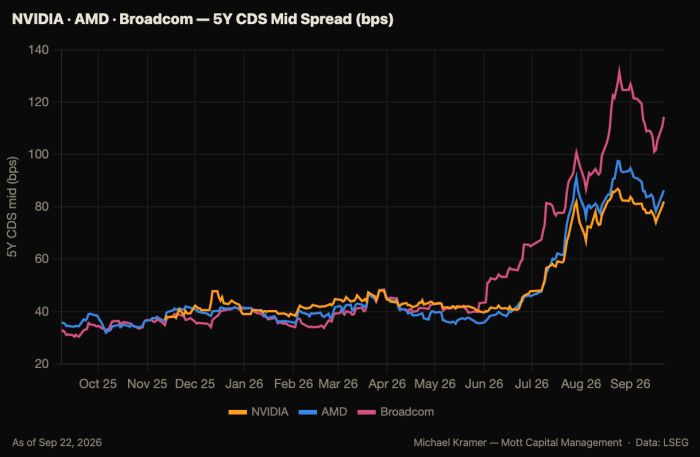
Another notable aspect of the recent rally in semiconductors is that CDS spreads for Nvidia (NVDA), AMD (AMD), and Broadcom (AVGO) have been widening. We have seen this divergence before, and if I remember correctly, the previous rally in semis did not last.
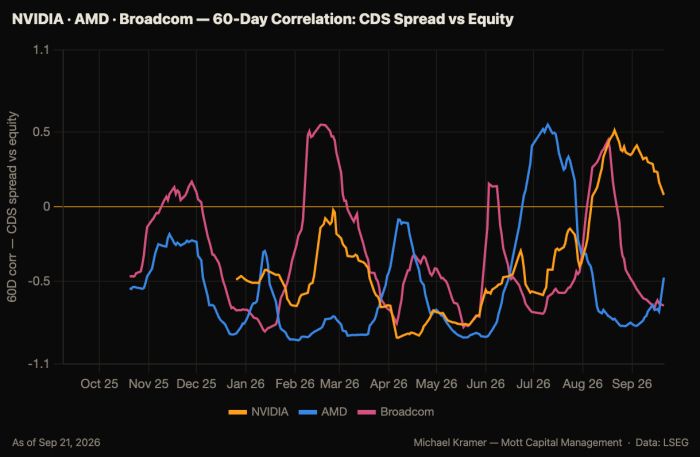
Generally, the relationship between a stock and its CDS is inverse, as we would expect growing concerns about credit risk to weigh on equity valuations and drive the stock price lower. But clearly, these are not normal times, especially in a market where options trading is off the charts.
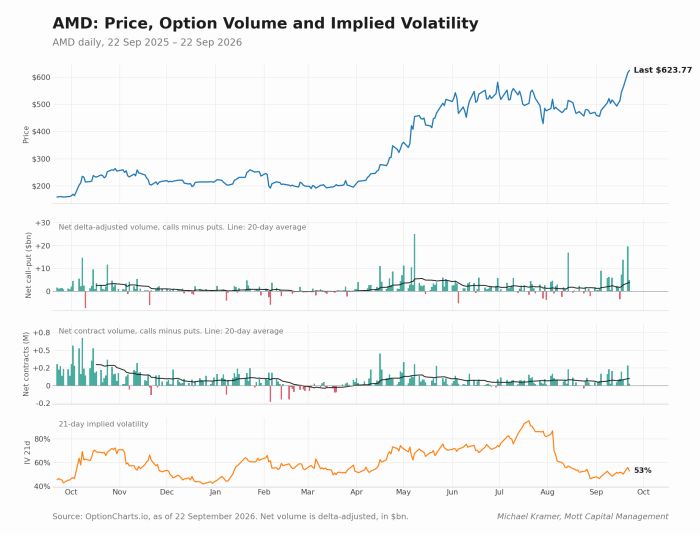
AMD, for example, has seen an explosion in net call volume over the past few days, which is probably behind the stock’s recent move higher.


Comments
Log in or sign up to join the conversation.