
I am looking at this spreadsheet, and I initially don't see much improvement in the rotation to suggest a return to a healthy stock market. Bonds are still way outperforming stocks, the small caps are under-performing, and the defensive groups are the leaders while the cyclicals lag.
Maybe I am expecting too much too soon? That may be the problem. The strength in bonds suggests rates are staying low, but that should help the high-PE stocks such as Technology, and we do see a tick up for QQQ and XLK.
Lower rates also help the heavy debt loads of the industrials, and we see a tick up for XLI and ITA.
Most importantly, lower rates always favor the dividend payers, and that is at least part of why we see leadership from XLRE, XLU, SDY.
There is also a bit of risk-on with the tick higher for IBB.
So, after taking my time and thinking it through, in general, this spreadsheet is making sense with a backdrop of low rates... and after a dramatic stock market sell off in December, several weeks of bounce in January, and now small signs of market health in February.

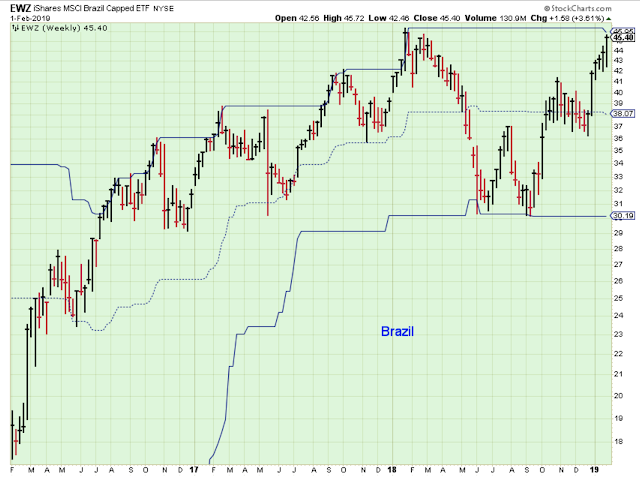
Brazil is challenging a new high.
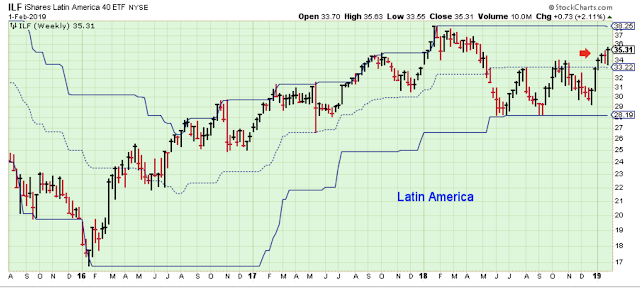
Latin America is breaking out of a base.
Russia is also breaking out.

Health Care is again a relative strength leader. The daily chart looks like it is headed for at least short-term gains.

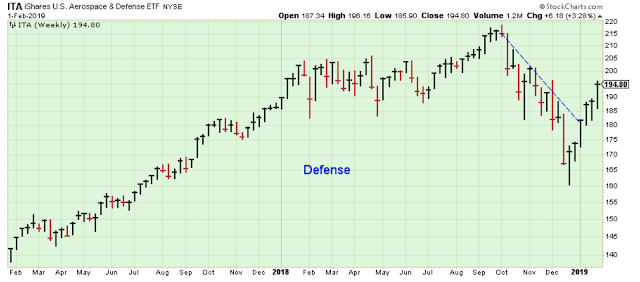
I always favor this group of weapon-makers, and even more so now that there is so much global tension. So I am biased, but this chart looks good to me.
This isn't the best chart I have seen, but last week's price performance is impressive.
The miners have a way yet before they prove to be trending higher, but I like the risk/reward with a stop under this week's low which is the 52-week half way mark.

These dividend-payers were hurt on Friday by the strong jobs report, and I can't say I like this volatile chart pattern over the past six months. But I do like a chart with prices breaking to new highs. So I am not sure about the REITs. I own this group but I am not ready to add to positions.

The Q's aren't on the leader list yet, but I like the looks of this chart. It is nice to see this strength with all the bad news for the mega-cap Technology stocks.
It is impossible to hold this group back for too long. If the stock market is headed higher, this ETF will probably be the leader again soon.

Outlook Summary
The long-term outlook is cautious, and improving. Upgraded from negative Feb. 2.
The medium-term trend is up as of Jan-4.
The short-term trend is up as of Dec-26.
The medium-term trend for bond prices is up as of Nov-16 (prices higher, yields lower).
Investing Themes:
Dividend-Payers
Semiconductors
Health Care
Gold Miners
Aerospace and Defense
Brazil, Latin America, Russia
Strategy During a Bull Market:
- Buy large cap stocks and ETFs at the lows of the medium or short-term market trends.
- Buy small cap growth stocks on breaks to new highs in the early stages of market trends.
- Reduce buying when the market trend is at the top of the range.
- Take partial profits when the market uptrend starts to struggle at the highs.
- The cardinal rule is never invest based on personal politics. The stock market can do well regardless of which political party is in control.


Comments
Log in or sign up to join the conversation.