


We were tracking the late stages of a higher-degree pullback in Ripple from the July 2025 highs. Specifically, we were focusing on a potential ending diagonal, which is typically considered a reversal pattern and can indicate that bearish momentum is weakening. CLICK HERE FOR THE PREVIOUS ARTICLE FROM JULY 13.
XRPUSD 4H Chart
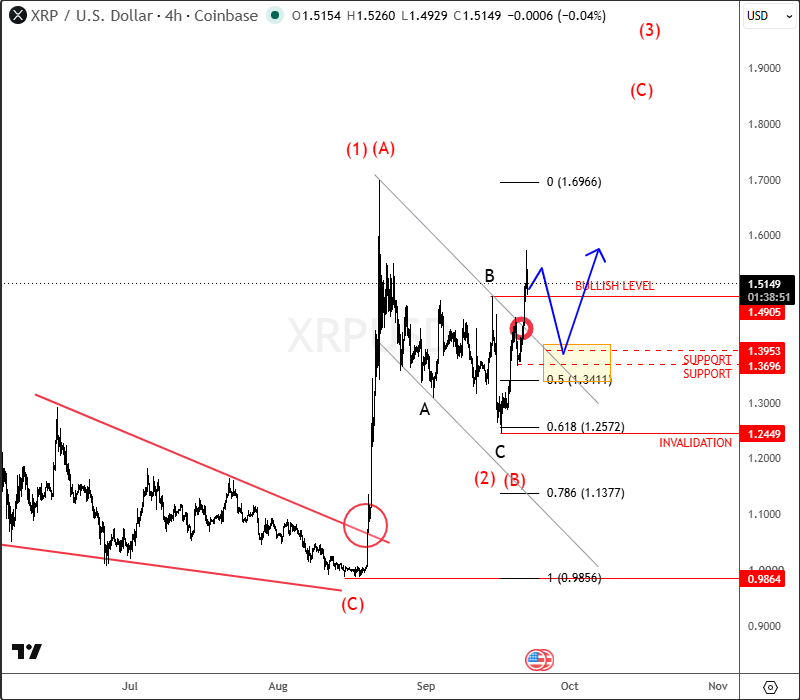
With the most recent price action, Ripple appears to be showing signs of a potential bottom, especially after an impulsive reversal from a new low. We can interpret this move as the first leg A/1 of a minimum three-wave A/1-B/2-C/3 recovery. Following the recent projected ABC correction in wave B/2, Ripple has produced another strong and impulsive rebound back toward the 1.50 area.
Based on the current structure, we can therefore expect further upside within wave C/3. However, traders should be aware of a potential short-term pullback, which could revisit the 1.40–1.35 support zone before the next leg higher.
XRPUSD Daily Chart
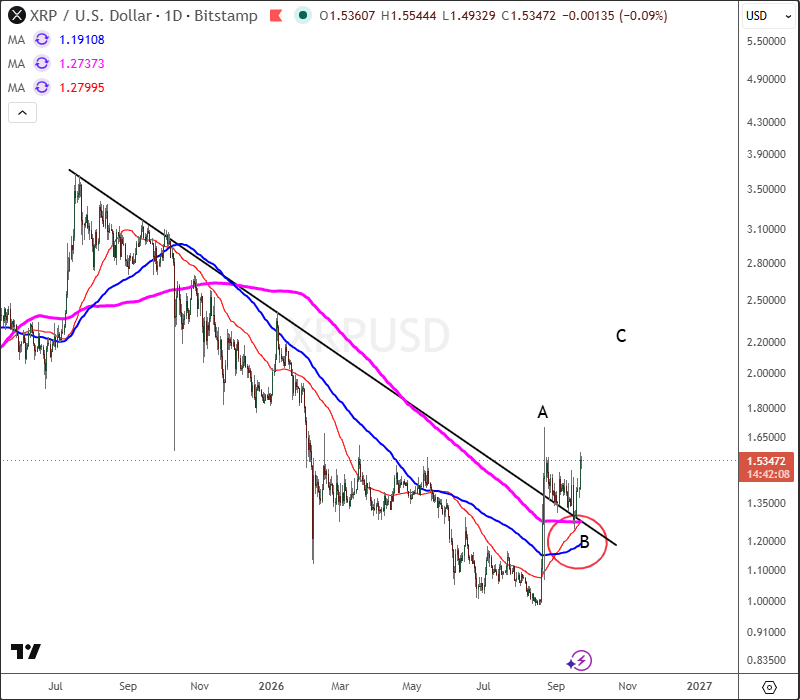
Notice that Ripple (XRPUSD) has made a nice rebound and is now pulling back toward several important moving averages, including the 50-day, 100-day, and 200-day SMAs. This area could act as strong support and provide a base for a larger recovery. From an Elliott Wave perspective, the current move could be part of wave B correction before a continuation higher in wave C of a minimum three-wave ABC rally. If the moving averages hold and XRP starts to stabilize, we could see another leg higher as the recovery develops.



Comments
Log in or sign up to join the conversation.