

The Republican tax refund stimulus is over.
Advance Retail Sales Month-Over-Month
Please consider the Census Department report on Advance Retail Sales for June of 2026.
Advance estimates of U.S. retail and food services sales for July 2026, adjusted for seasonal variation and holiday and trading-day differences, but not for price changes, were $763.6 billion, down 0.6 percent (±0.4 percent) from the previous month, but up 5.0 percent (±0.5 percent) from July 2025.
Total sales for the May 2026 through July 2026 period were up 6.3 percent (±0.5 percent) from the same period a year ago.
The May 2026 to June 2026 percent change was unrevised from up 0.2 percent (±0.3 percent).
The key phrase above is “adjusted for seasonal variation and holiday and trading-day differences, but not for price changes.”
The report only lists nominal sales, not real (inflation-adjusted sales). It’s real sales that feed GDP.
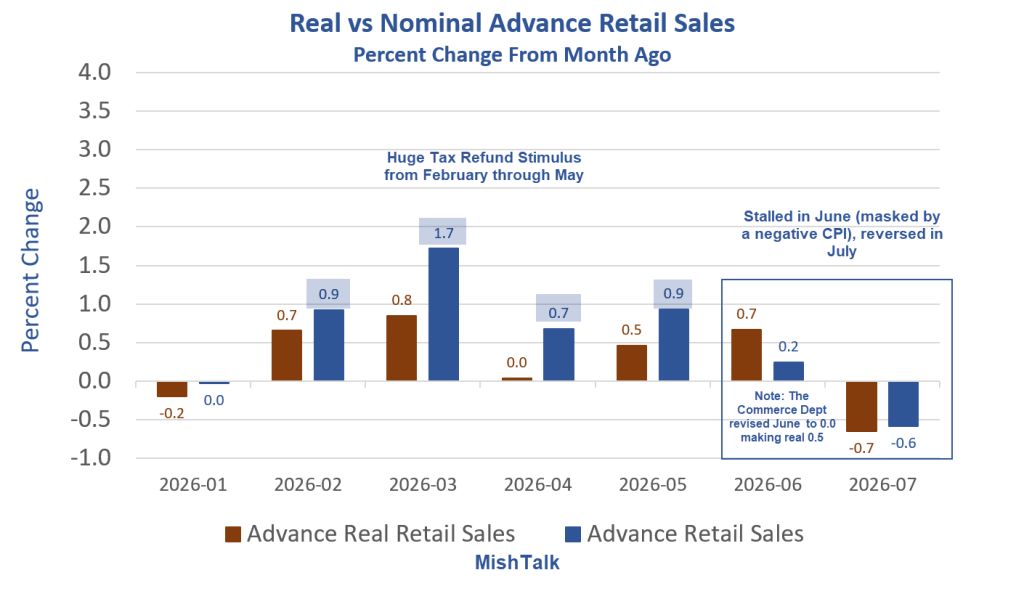
Note the negative revision to June. “The May 2026 to June 2026 percent change was unrevised from up 0.2 percent (±0.3 percent).”
The Commerce Department does not revise the numbers in data feed downloads. Thus June nominal was 0.0 percent and June real was 0.5 percent not 0.7 percent as shown on my chart.
Advance Retail Sales Month-Over-Month
Real vs nominal advance retail sales percent change month over month
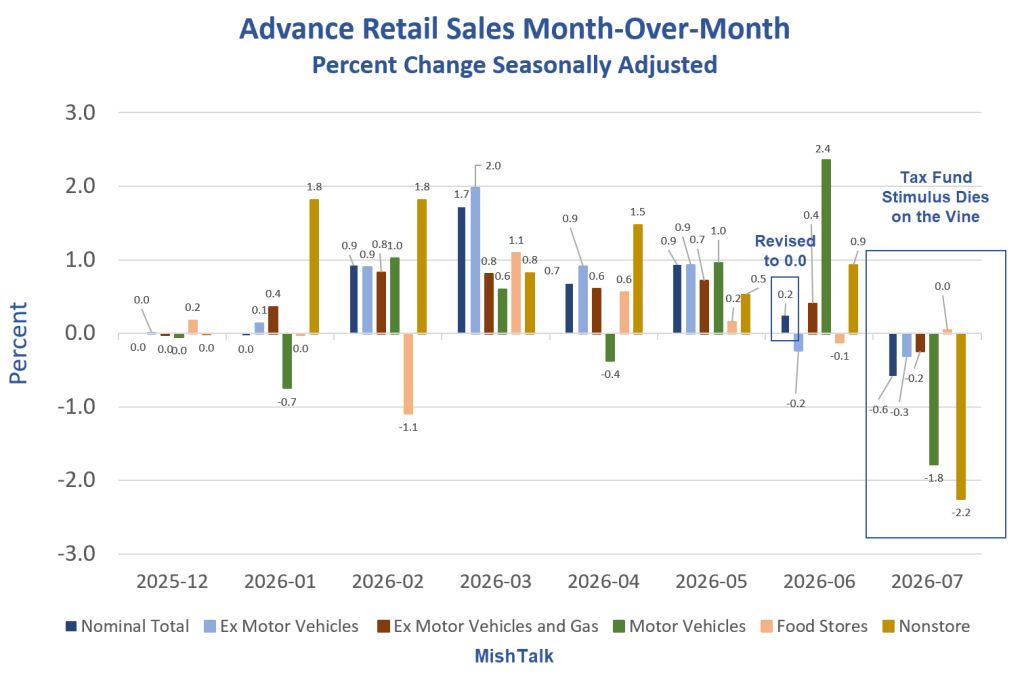
Month-Over-Month Nominal Retail Sales
Total: -0.6 percent
Excluding Motor Vehicles: -0.3 percent
Excluding Motor Vehicles and Gas: 0.4 percent
Motor Vehicles: -1.8 percent
Nonstore Sales: -2.2 percent
Food Service: 0.5 percent
Food Stores: 0.2 percent
Gas Stations: -0.9 percent
General Merchandise: 0.3 percent
Weakness is pervasive except food service. Note the huge 2.2 percent decline in nonstore sales.
Real vs Nominal Retail Sales Month-Over Month Percent Change
Nominal Total: -0.6 percent
Real Total: -0.7 percent
Those numbers are from the lead chart.
Real vs Nominal Advance Retail Sales percent Change from Year Ago
Year-over-year real vs nominal retail sales
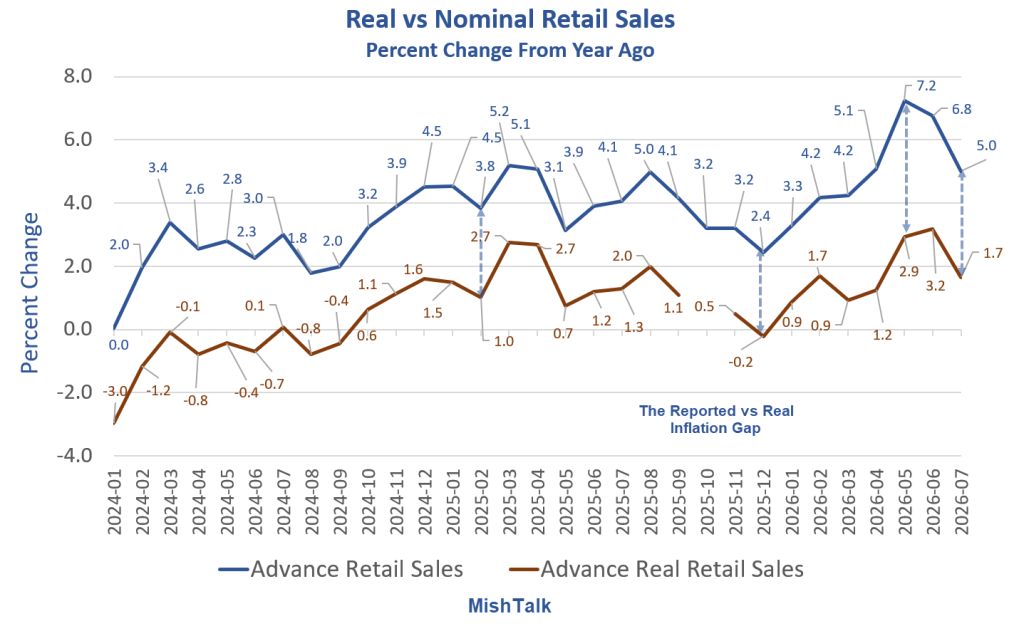
Nominal sales are up 5.0 percent from a year ago. Real sales are only up 1.7 percent/
The difference is the inflation gap, currently 5.0 minus 1.7. That’s 3.3 percentage points out of 5.0.
Thus, inflation accounts for 66 percent of the increase in nominal retail sales from a year ago.
Real vs Nominal Retail Sales in Millions of Dollars
Real vs nominal retail sales in millions of dollars
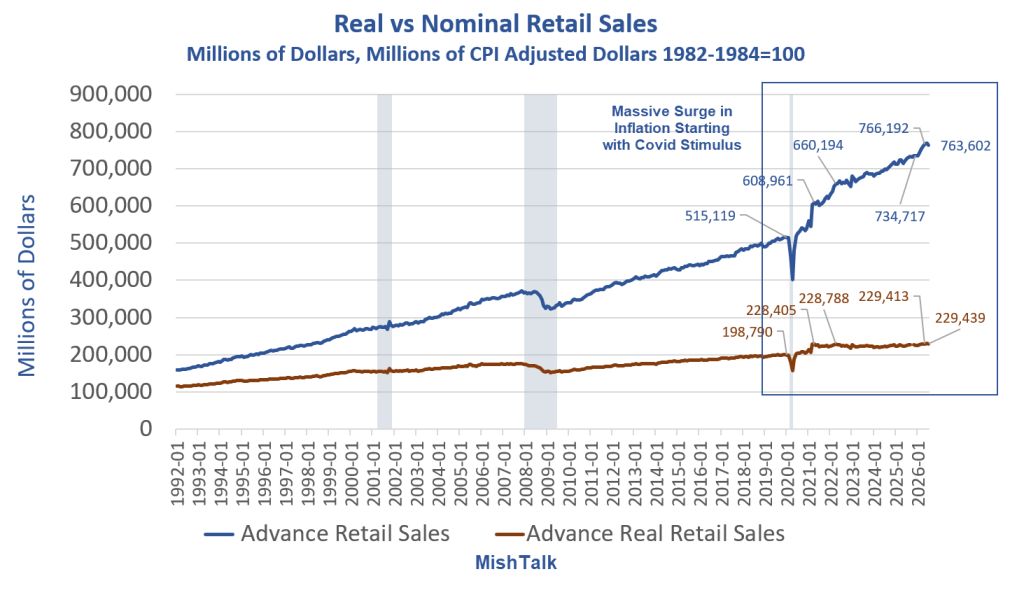
There was a massive surge in inflation in 2020 and 2021 with three rounds of largely unwarranted and definitely excessive rounds of fiscal stimulus under Trump and Biden.
Trump wanted more fiscal stimulus than Congress gave him. Then Democrats went totally nuts under Biden.
The Fed compounded this error with ridiculous QE lowering mortgage rates and putting still more money into people’s pockets.
The Fed has never admitted this error.
Real vs Nominal Retail Sales Detail
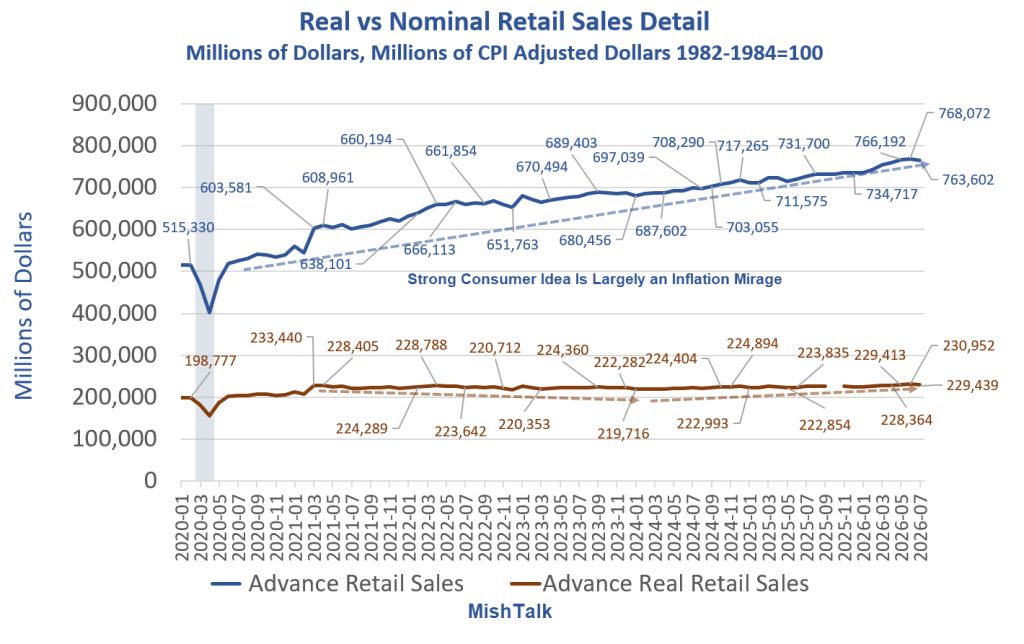
Real vs nominal retail sales in millions of dollars detail
Real vs Nominal Sales Notes
Real retail sales peaked in March of 2021 at 233,440. They are now 229,439 That’s a decline of 2,344 or 1.7 percent.
In March of 2021, nominal sales were 603,581. They are now 763,602. That’s an increase of 153,504 or 26.5percent.
Over 100 percent of the increase in retail sales since March of 2021 is due to inflation.
Didn’t someone campaign on fixing this?
Related Posts
August 12, 2026: July CPI Report Not as Good as Numbers Look at First Glance
The consumer price index rose the expected 0.1 percent, but significant troubles lie ahead.
August 12, 2026: Look Ahead Inflation Numbers Do Not Support a Fed Pause in September
Today’s CPI report is history. Let’s look ahead.
August 13, 2026: Producer Price Index PPI Was Unchanged in July but What’s Ahead?
The PPI was flat in July, mostly due to big decline in gasoline and food. This won’t last.
Correction
In two places I incorrectly referred to the BLS revisions, now corrected to Commerce Department revisions.


Comments
Log in or sign up to join the conversation.