

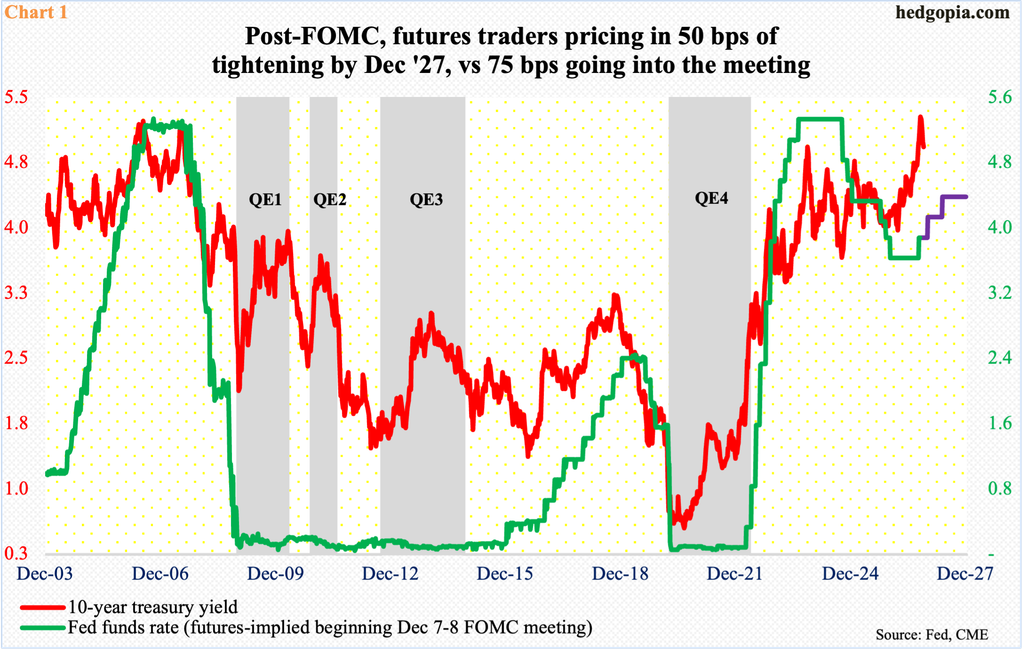
As expected, the fed funds rate was left unchanged last week, and futures traders, post-FOMC meeting, unexpectedly lowered the number of quarter-point cuts through December 2027 to two from three pre-meeting. It is possible they are anticipating tighter financial conditions through downward pressure on equities.
In a 10-2 vote, the fed funds rate last week was held steady at a range of 3.75 percent to four percent. The benchmark rate was unanimously raised by 25 basis points in the September meeting; this was the first hike since July 2023.
The FOMC (Federal Open Market Committee) decision not to move in last week’s meeting was expected, although until just a few weeks ago markets were expecting a hike. Interestingly, the CME’s FedWatch tool now shows traders betting on two 25-basis-point hikes by the end of next year, with the next hike coming this December (Chart 1); pre-FOMC meeting, they were pricing in three hikes.
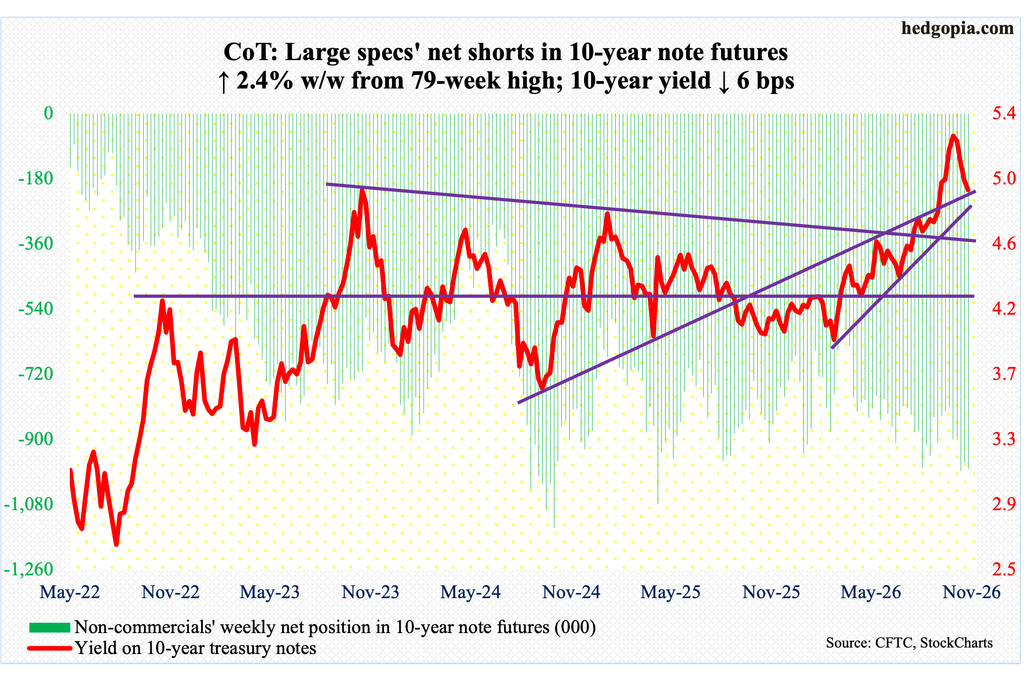
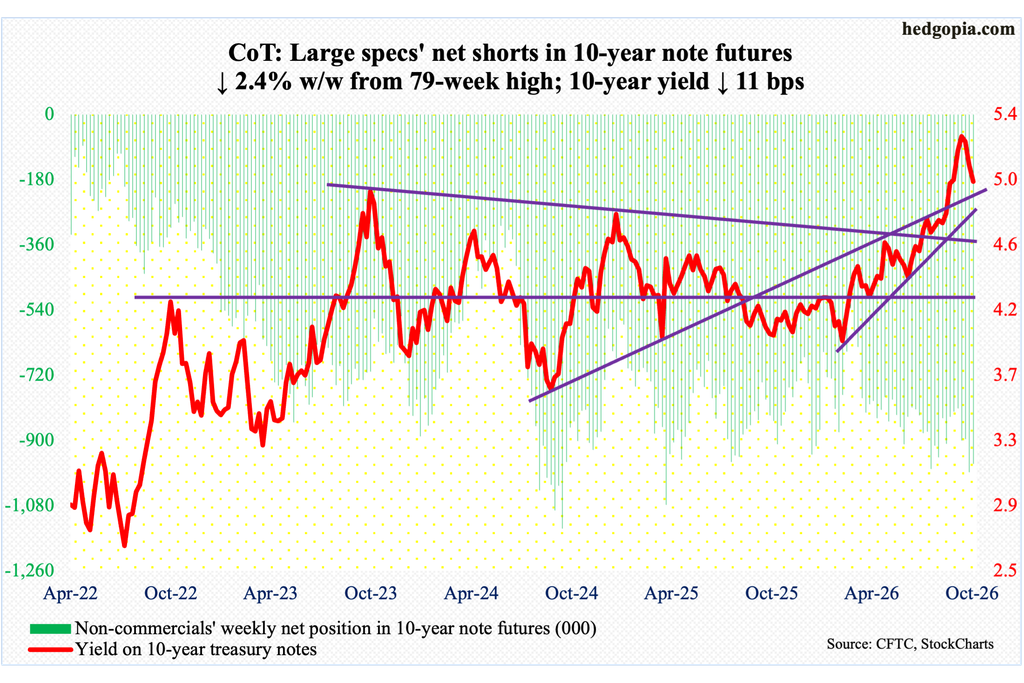
This is taking place concurrent with the drop in the 10-year treasury yield from a high of 5.36 percent on October 7, which was the highest print since April 2002, to the current 4.93 percent, down six basis points last week. These notes were yielding 3.96 percent in February, thus remains overbought on several timeframes.
Bond bears (on price; price and yield hold an inverse relationship) benefit if long rates head higher, but they struggled to defend five percent on the 10-year. There is decent support at 4.75s, and it is probable this level gets defended.
Chair Kevin Warsh last week continued to warn about persistently elevated inflation, which he has been doing since his appointment in May.
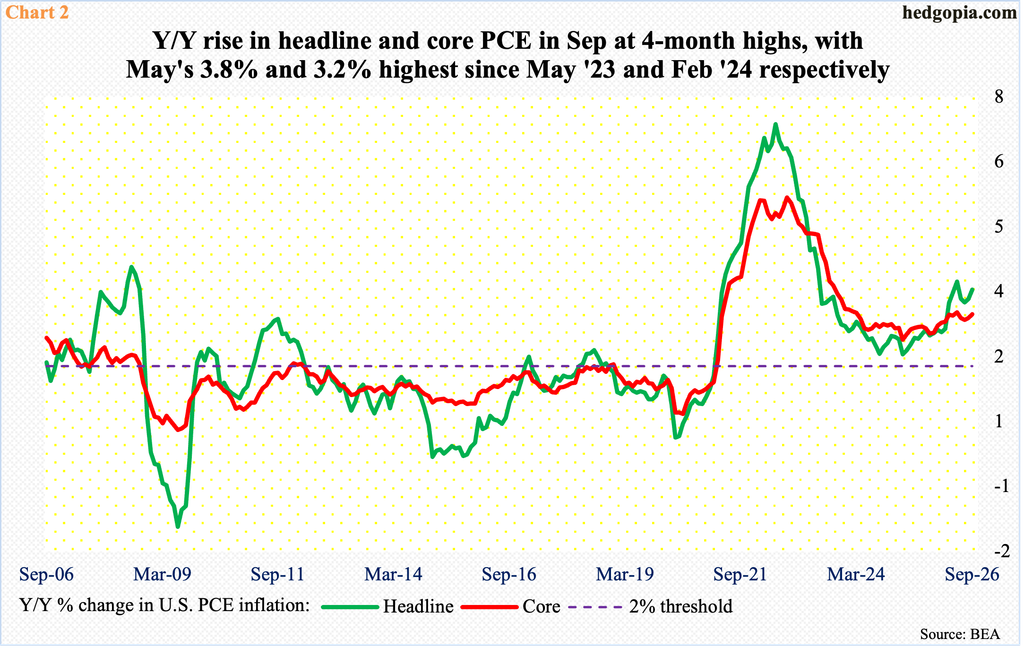
Last Thursday, a day after the conclusion of the two-day FOMC meeting, September’s PCE (personal consumption expenditures) was published, and it was hot, with the headline and core rising 3.65 percent and 3.12 percent from a year ago respectively. In May, they grew at a rate of 3.82 percent and 3.16 percent, which represented the steepest year-over-over rise in 36 months and 31 months, in that order. The central bank targets two percent on the core.
In June and February of 2022, headline and core hit four-decade highs of 7.22 percent and 5.57 percent respectively before going the other way. They subsequently bottomed at 2.26 percent and 2.56 percent in March 2025 respectively before reasserting themselves (Chart 2).
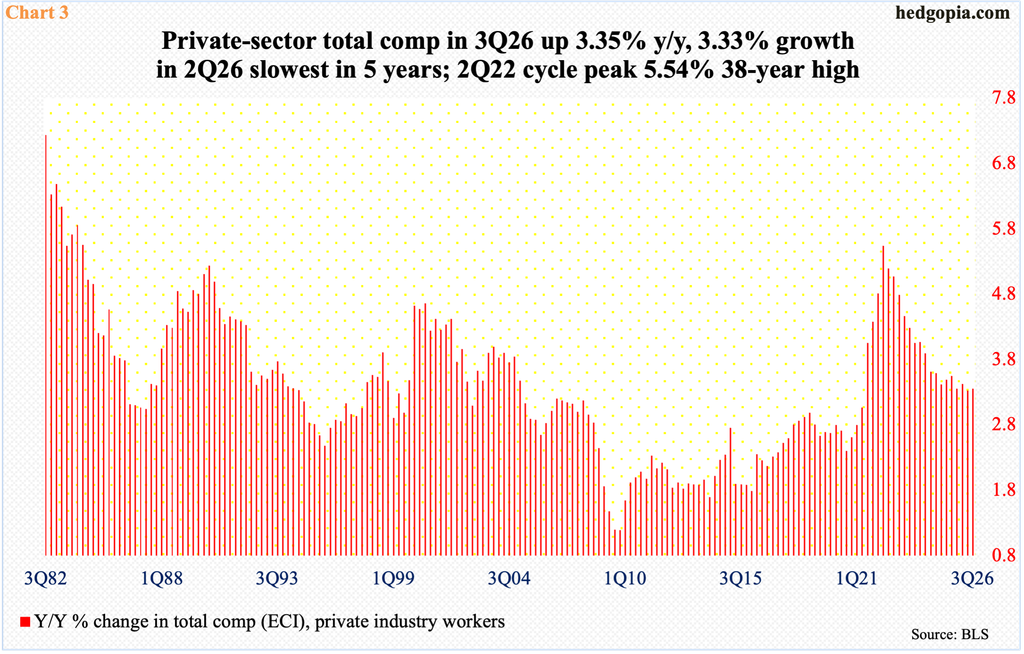
Consumer inflation presently is handing out plenty of ammunition to FOMC hawks to press their case. Doves, however, can point to a lack of alarming rise in wages.
In the September quarter, private-sector total compensation grew 3.35 percent year over year. This was close to the June-quarter pace of 3.33 percent, which was the lowest in five years (Chart 3).
This metric has trended lower since peaking at 5.54 percent in 2Q22, which was the highest rate in 38 years.
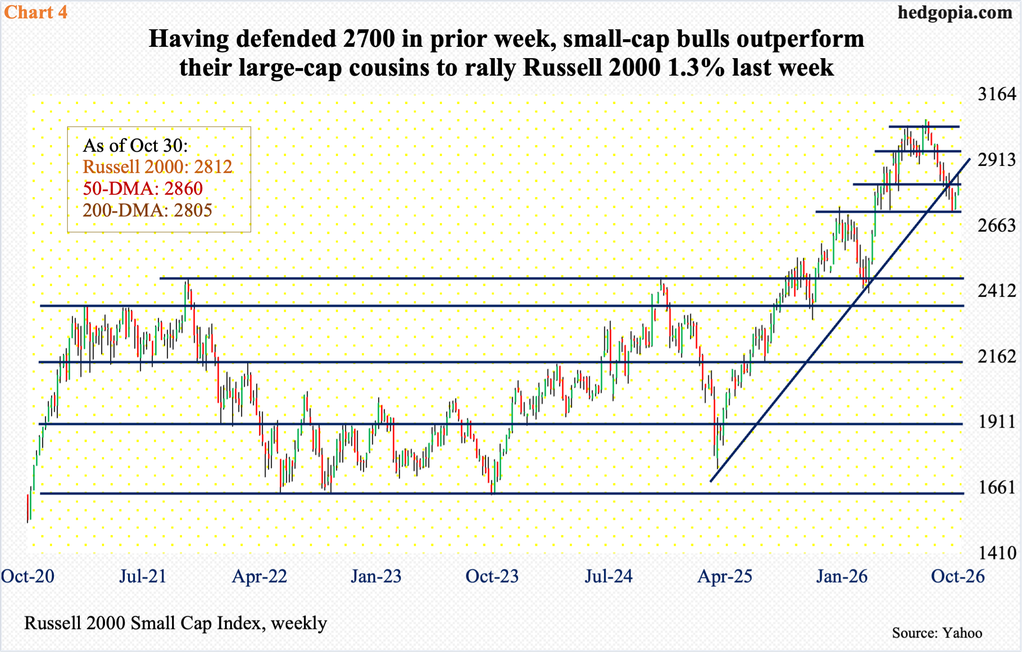
The drop in long rates in recent weeks and the softened outlook for short rates have the last couple of weeks provided a boost to small-caps, which otherwise had been taking a beating.
Last week, unlike its large-cap brethren, the Russell 2000 was up, rallying 1.3 percent to 2812. This was the second up week in a row. Before that, the small cap index suffered six weekly losses in a row – and eighth in nine. It earlier peaked at 3070 on August 14.
The back-to-back weekly gains came after the bulls were able to defend 2700. The 200-day (2805) was defended last week, and the 50-day (2860) lies above. Alongside the 50-day, the underside of a broken trendline from April last year pose as hurdles for the bulls (Chart 4).
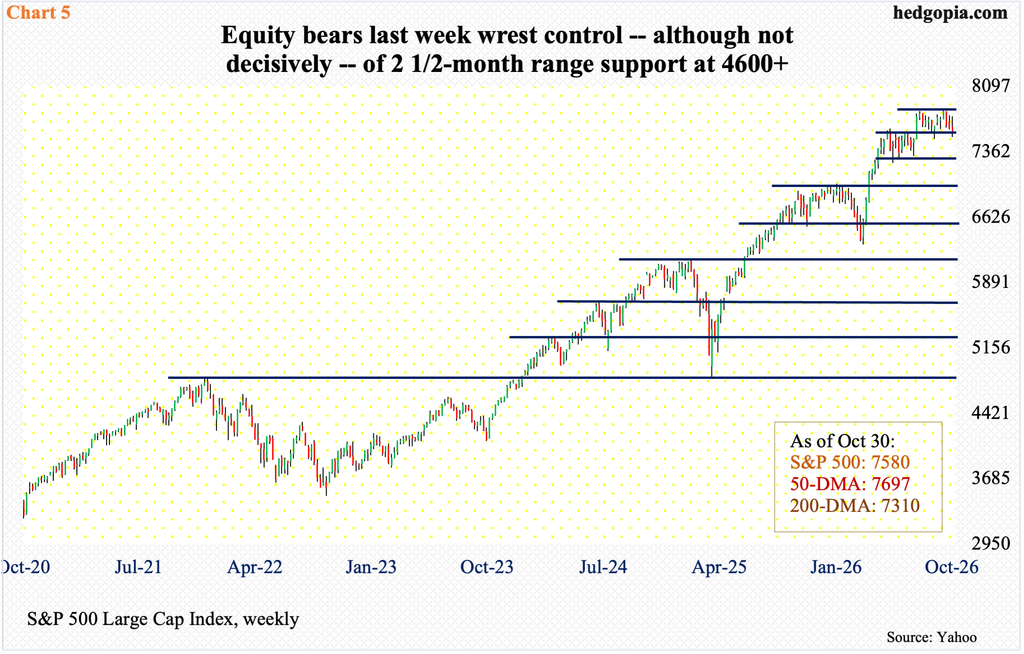
Large-cap bulls in the meantime failed to cash in on the changed outlook for rates, or they could simply be running out of buying power.
From the March 30 low of 6317 through the October 6 all-time high of 7845, the S&P 500 added 24.2 percent; going back further to April last year, the large cap index was up a massive 62.2 percent.
Last week, the S&P 500 finished down 0.6 percent to 7580, giving back gains of 1.8 percent through Wednesday’s session high 7758. For bulls’ consolation, Friday’s session low 7528 was bought, although they have now lost 7600-plus, not to mention the 50-day at 7697.
For two and a half months, the index went back and forth between resistance north of 4800 and support north of 4600 (Chart 5). Prior to this, it consolidated for a couple of months after peaking at 7621 on June 2, with a breakout on August 4.
Failure by the bulls to quickly regroup and reclaim 7600-plus will have opened the door for the bears to eye lateral support at 7300s, with the 200-day at 7310.
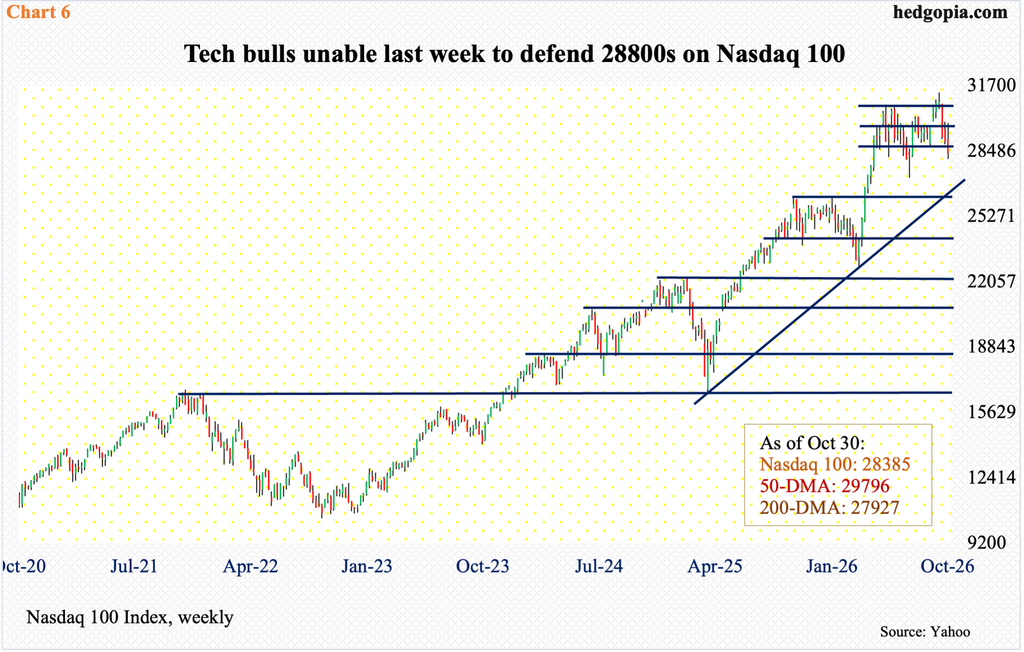
Last week, the Nasdaq 100, too, was up 3.1 percent through Wednesday’s session high 29849, but all of it was given away and then some. By the end of the week, the index gave back two percent to 28385.
The tech-heavy index, too, has had massive gains before hitting a fresh all-time high of 31361 on October 6. From the March 30 low of 22841 through that high, the Nasdaq 100 jumped 37.3 percent; going back further, it surged 89.6 percent from the April 2025 low of 16542.2.
Conditions are overbought, and the bulls are struggling to save crucial support. Last week, horizontal support at 28800s was compromised (Chart 6), although Friday’s session low 28093 was embraced just above the 200-day (27927). Should a decisive – and successful – test of the 200-day follows in the sessions ahead, they are likely to lock horns with the bears at 28800s.

Comments
Log in or sign up to join the conversation.