


There is a growing, although not overwhelming, feeling in the markets that the midterm results have raised the odds of a slowdown in the U.S. economy. Arguably, extremely overbought equity markets are beginning to buy into this thesis, although faintly at the present.
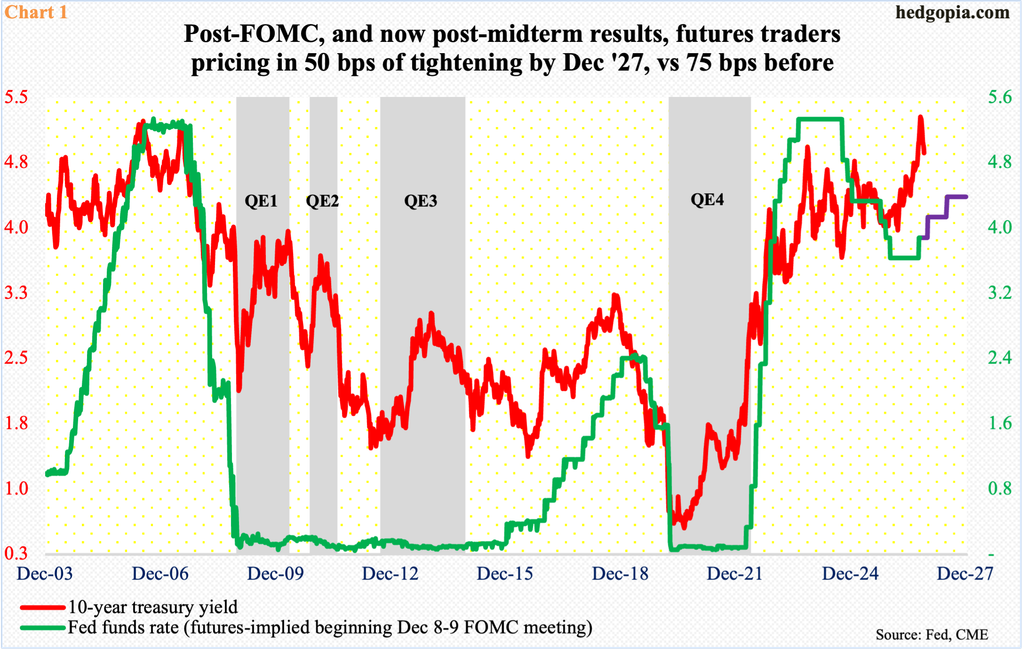
For the first time since July 2023, the fed funds rate was raised by a quarter point in September to a range 3.75 percent to four percent. In May, Kevin Warsh was appointed chairman of the Federal Reserve, and he was sounding tough on inflation, which has remained above the central bank’s stated goal of two percent for over five years now. For a while, markets were expecting another hike in October, but the benchmark rates were left unchanged in last month’s FOMC meeting. As things stand, a 25-basis-point increase is expected next month (Chart 1). After this, CME FedWatch shows, only one hike is expected next year, to finish 2027 between 4.25 percent 4.5 percent.
In other words, futures traders have significantly reduced bets on continued upward pressure on the short end of the yield curve. Even for next year, these traders are assigning probabilities of less than 60 percent on a hike. Most recently, they downshifted their expectations after the midterm election results in which the Republicans faced a rout.
Democrats’ comprehensive victory in last week’s elections meaningfully raises the odds that the pace at which data centers are being built across the nation is headed for a deceleration, and this means less capital spending by particularly the U.S. hyperscalers including Amazon (AMZN), Microsoft (MSFT), Google parent Alphabet (GOOG), Facebook parent Meta Platforms (META) and Oracle (ORCL).
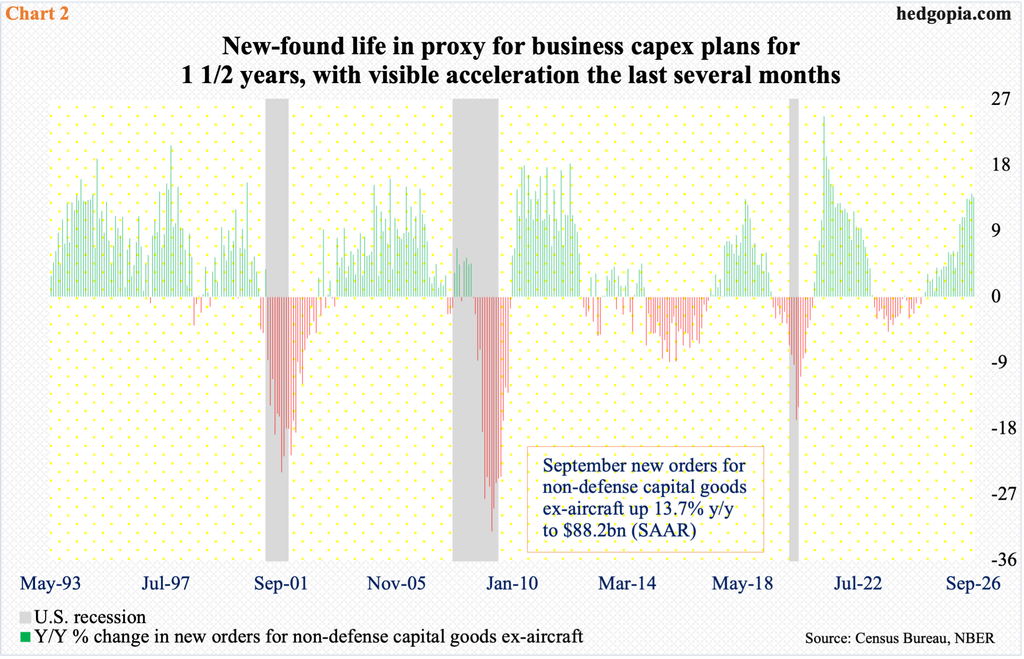
Buildout of data centers has contributed greatly to the overall growth of the economy. This is evident in year-over-change in new orders for non-defense capital goods ex-aircraft, which can be used as a proxy for business capital spending plans. Two years ago, in November 2024, this metric switched to green after months of red. Until January this year, growth was still in low- to mid-single digits, before picking up the pace.
In August, these orders shot up 14.1 percent from a year ago, and this was the biggest y/y jump in five years (Chart 2); September softened a bit to 13.7 percent, but this was enough to establish a fresh record of $88.2 billion (seasonally adjusted annual rate).
In the event the expected deceleration in economic growth turns into reality, this should begin to get reflected in small-caps, which inherently have the most exposure to the domestic economy, versus mid- to large-caps which also have international exposure.
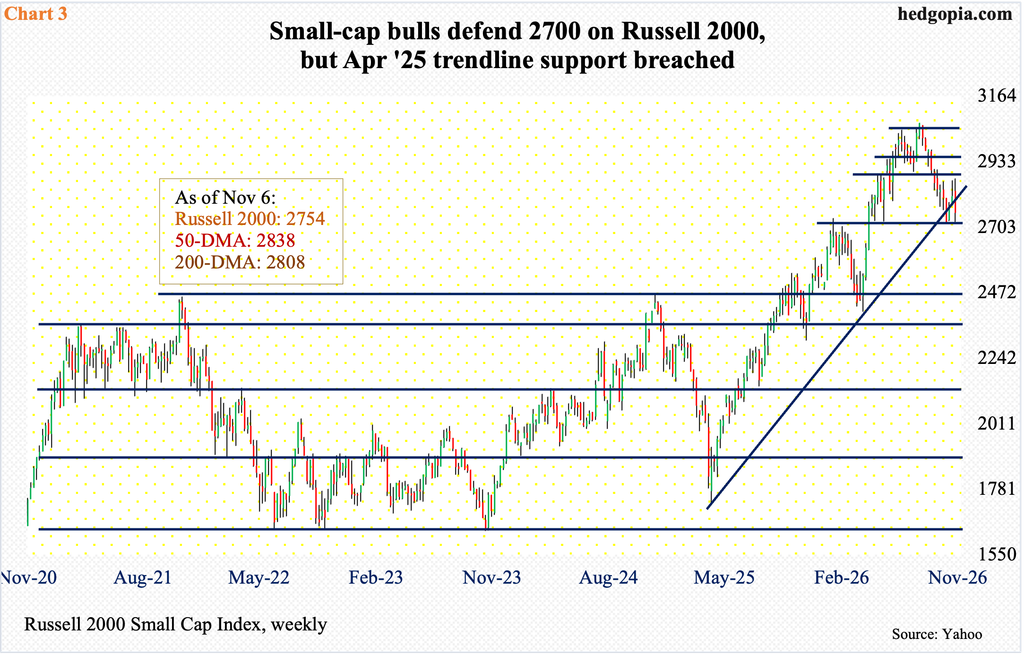
Indeed, peaking at 3070 on August 14, the Russell 2000 remained under pressure until successfully testing horizontal support at 2700 four weeks ago; small-cap bulls’ attempt to rally after this has not amounted to much.
Last week, the Russell 2000 dropped 2.1 percent – which is much better than its large-cap cousins, by the way – to 2754, with Friday’s session low 2721 once again drawing bids. That said, bulls were also quick to push the sell button at/just under support-turned-resistance at 2880s, with Wednesday ticking 2875 intraday.
The Russell 2000 is also under a rising trendline from the low of April 2025 (Chart 3).
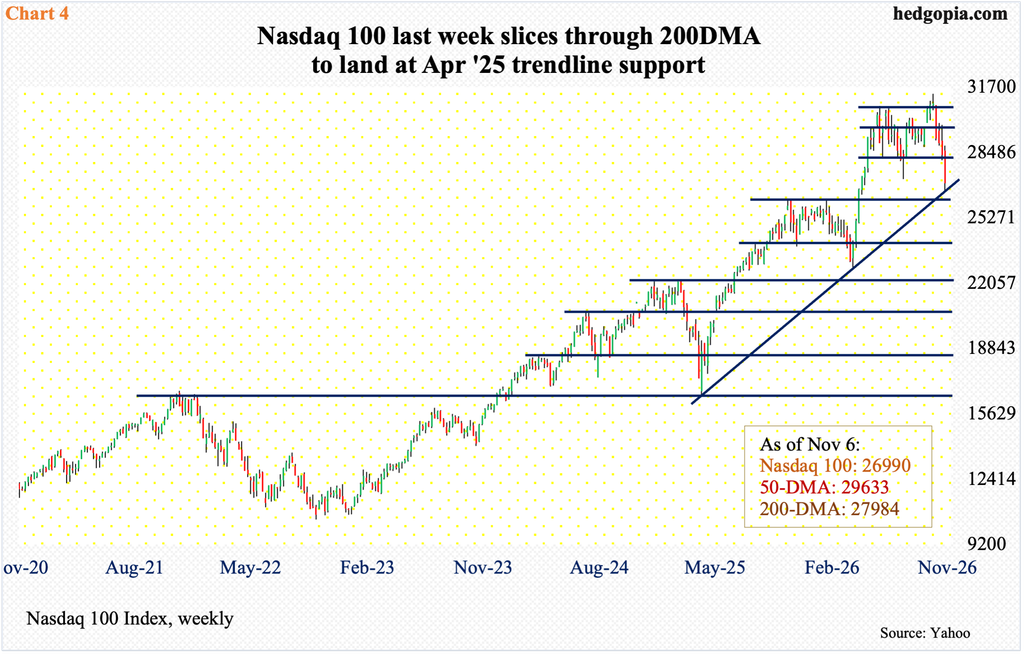
A similar trendline on the Nasdaq 100 was kissed last Thursday when the index tagged 26606 intraday (Chart 4). For the week, it declined 4.9 percent to 26990; on Thursday alone, the tech-heavy index gave back 6.4 percent.
Right below the said trendline support lies crucial horizontal support at 26100s, which the Nasdaq 100 broke out of in April, subsequently reaching 31361 on October 6.
It is hard to imagine the tech bulls yielding this dual support right away. The daily is oversold. In the event of a rally near term, bears are for sure to show up at 28100s – just above the 200-day (27984), which was compromised last Thursday – and then 28800s.
Bulls are sitting on tons of gains and would not feel the pain until the tech trade enters a bear market. From the March 30 low of 22841 through the October high, the Nasdaq 100 jumped 37.3 percent; going back further, it surged 89.6 percent from the April 2025 low of 16542.
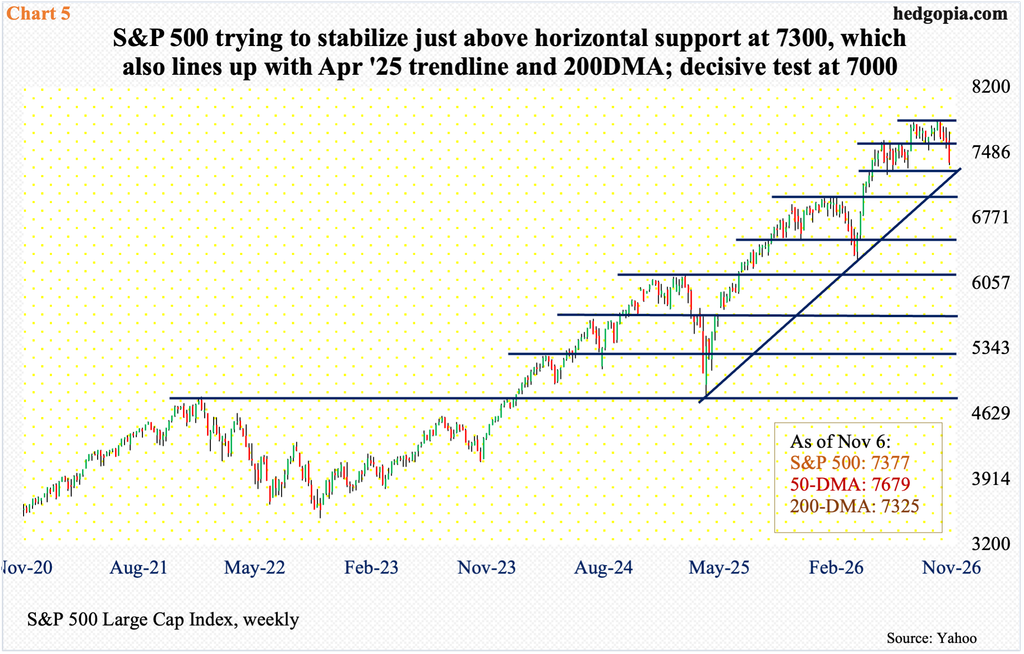
Through its all-time high of 7845 posted on October 6, the S&P 500, too, rallied 24.2 percent and 62.2 percent respectively from the lows of March this year and April last year. That is a lot of paper profit. Through last week’s close (7377), the large cap index is down six percent from its high and was down 6.3 percent through last Thursday’s session low 7350.
Unlike the Nasdaq 100, the 200-day (7325) is intact on the S&P 500. After the index bottomed this March, it soon broke out of 7000 mid-April, and this is a crucial level to watch. Besides, this is also where trendline support from the April 2025 bottom lies (Chart 5). So, it is a trifecta of support and is unlikely to give in at the very first try. If, however, the bulls cannot hold the line and succumb under selling pressure, then we know more investors/traders are pricing in meaningful deceleration in the economy. This will be particularly so if 7000 is breached. In this scenario, small-caps should begin to wilt as well.
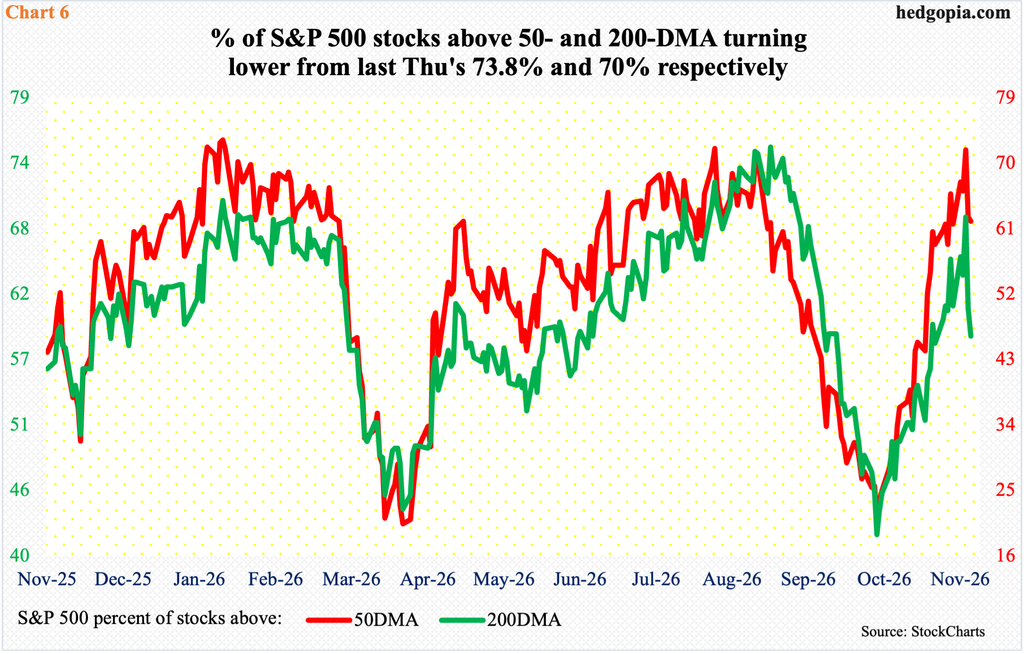
At the end of last week, 62 percent of S&P 500 stocks were above their 50-day and 58.8 percent were above their 200-day (Chart 6); this compares with Thursday’s intraday highs of 73.8 percent and 70 percent, in that order.
If past is prelude, reliable bottoms cannot be had until they hit the low-20s or mid- to high-teens.


Comments
Log in or sign up to join the conversation.