


The two-month, 200-point rally leading to the early-October peak in the S&P 500 failed to excite buyers to take on leverage. Buyers showed up last week defending support on the major equity indices, but the worst is not over just yet.
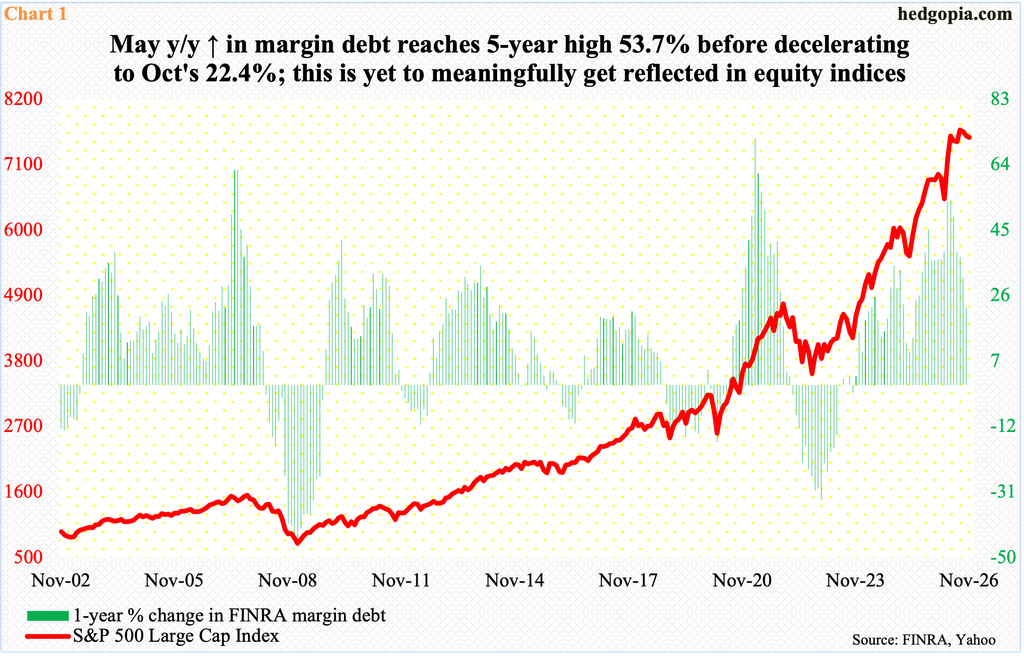
FINRA margin debt peaked this June at $1.50 trillion. In March this year, when the major U.S. equity indices bottomed, margin debt was $1.22 trillion; going back further, in April last year when equities reached a major low, margin debt was $850.6 billion.
After jumping 76.6 percent from the April 2025 low, margin debt has trended lower from the June peak. In October, it declined $31.7 billion month over month to $1.45 trillion.
Importantly, the S&P 500, too, peaked in June at 7621 before going sideways for a couple of months and then breaking out in August, followed by a fresh high 7845 posted on October 6. But this 200-point-plus rally failed to excite the bulls, as they were less willing to take on leverage.
With a coefficient correlation of 96 percent going back to January 1997, margin debt and the S&P 500 otherwise has a tight relationship.
In Chart 1, the large cap index is pitted against year-over-year percent change in margin debt. In May, margin debt grew at a five-year high 53.7 percent; by October, this had decelerated to 22.4 percent. The S&P 500 is yet to catch up with it, or it can be argued that it has begun. The index, in fact, did drop 6.3 percent from its high to an intraday low of 7350 on the 5th this month before attracting bids. Regardless how things evolve near term, it is only a matter of time before a sustained drop in margin debt begins to negatively impact the S&P 500.
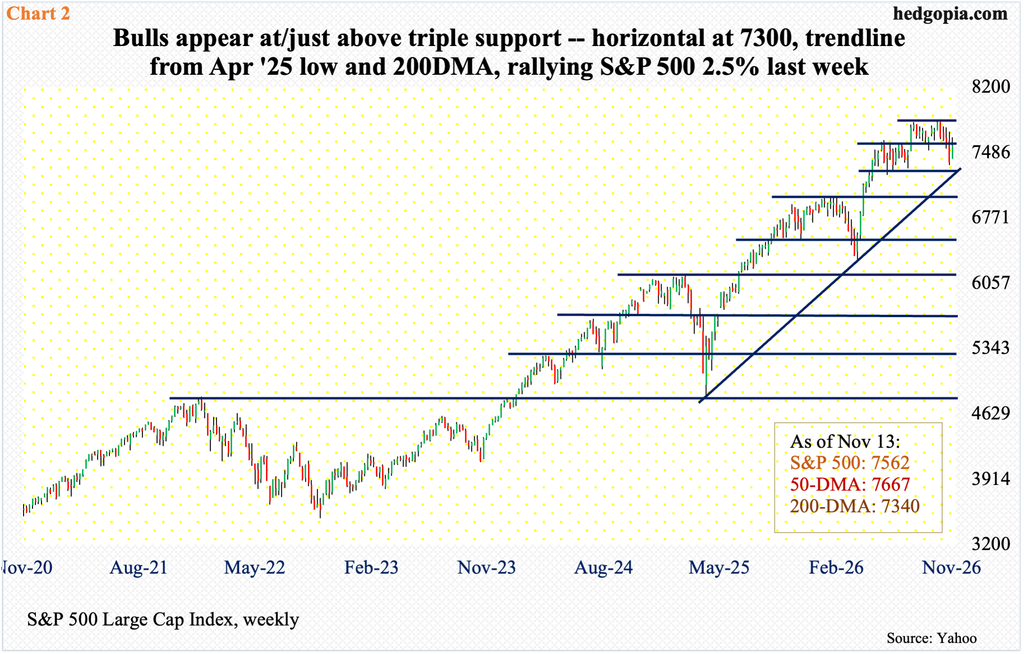
The 6.3-percent drop in the S&P 500 is trivial considering the gains it has enjoyed since the lows of March this year and April last year – 24.2 percent and 62.2 percent, in that order. Bulls hence are sitting on tons of gains; the technically oriented ones among them therefore are probably watching with keen interest if crucial support gets defended. It has thus far.
On the 5th, as mentioned earlier, the S&P 500 ticked 7350. Just north of 7300 lies crucial horizontal support going back to May. This is also where the 200-day (now 7340, as the average is slightly rising) lies. Right around there rests a rising trendline from April last year. So, we are talking not one, not two but three levels of support (Chart 2), and they held.
That said, there is work ahead for the bulls if they aim to build on last week’s price action when the S&P 500 added 2.5 percent to 7562. Bears pounced on Thursday’s session high 7653, which was just below the falling 50-day at 7667. Bulls also struggled to save crucial price point just north of 7600.
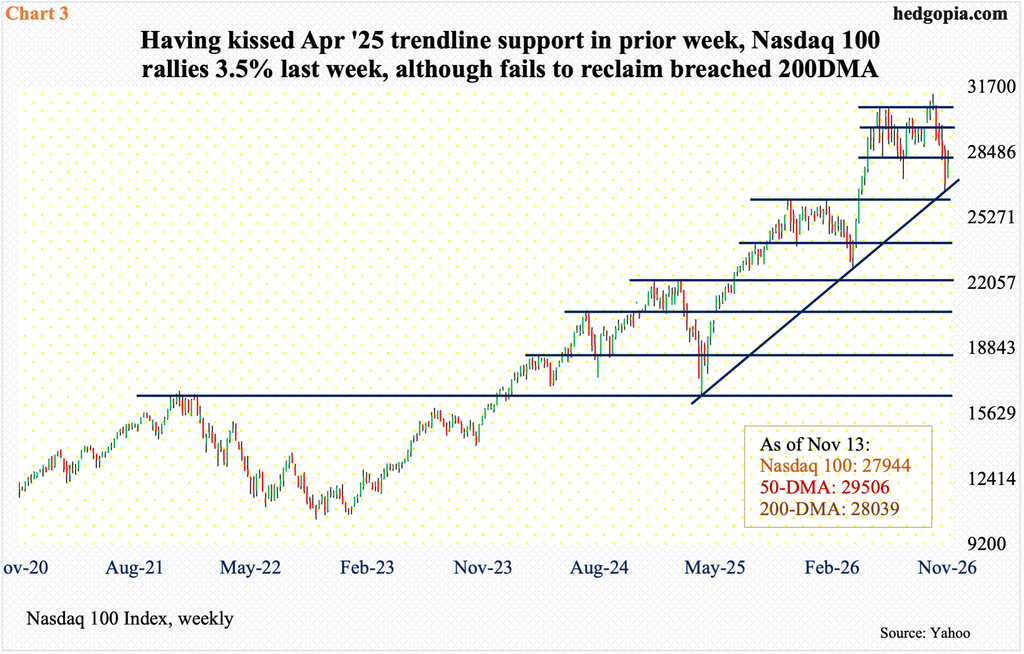
That trendline in question also drew bids on the Nasdaq 100, which six sessions ago, on the 5th, sliced through the 200-day (28039, slightly rising) but the session low 26606 successfully kissed the trendline from the April 2025 low. Last week, bulls regained the average on Wednesday, when the tech-heavy index tagged 28594 but let it slip by the end of the week when the Nasdaq 100 closed at 27944, up 3.5 percent for the week.
As is the case with the S&P 500, bulls have done very well betting on the Nasdaq 100, which shot up 37.3 percent and 89.6 percent respectively from the lows of March this year and April last year before peaking at 31361 on October 6. From that high through the November 5 low, the tech-heavy index gave back 15.2 percent before generating interest from the buyers.
But it is hard to argue this is a durable bottom. A crucial test does not occur until a breakout retest does not occur at 26100s (Chart 3). A similar breakout retest of importance on the S&P 500 rests at 7000 (Chart 2).
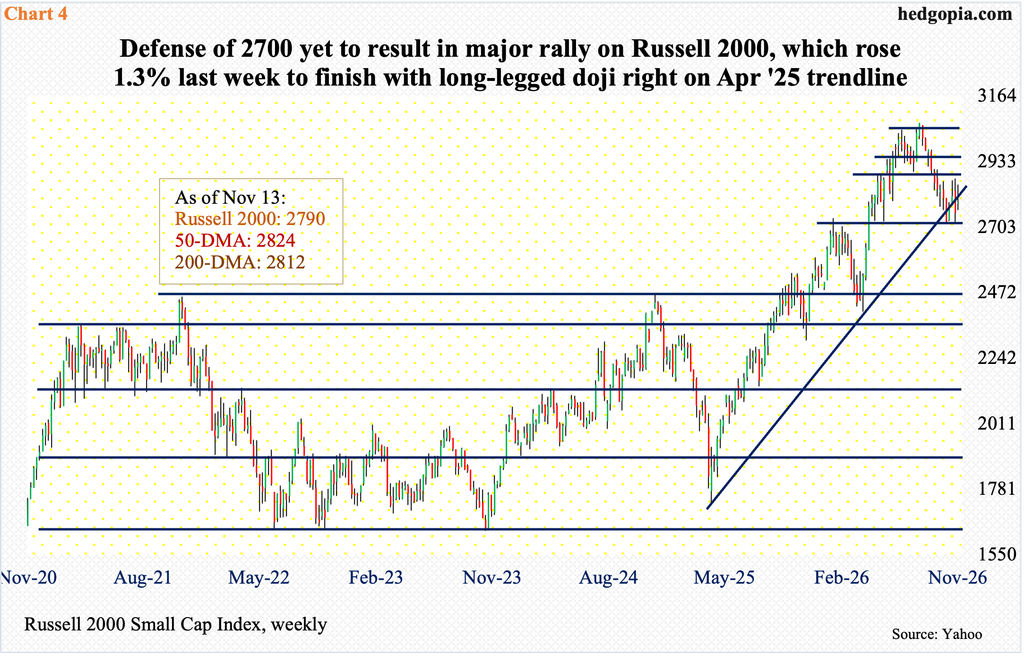
Bulls and bears also vigorously fought for control on the Russell 2000 last week, when the small cap index rallied 1.3 percent to 2790. This was a subdued performance versus its large-cap peers and followed a sustained downward pressure since the index peaked at 3070 on August 14.
On the way down, small-cap bulls began to put their foot down at horizontal support just north of 7000, and this was five weeks ago when on October 14 the Russell 2000 tagged 2720, followed by several more in subsequent weeks, including the week before.
Last week, the index finished right on trendline support from the low of April 2025 (Chart 4). Both the 50- and 200-day remain slightly above, with attempts to reclaim the averages denied last week.
As things stand, bulls deserve the benefit of the doubt as long as 2700 is intact, but they also need to be able to retake 2880s as soon as possible; last week, sellers showed up Monday at 2853 and then again at 2852 on Wednesday.



Comments
Log in or sign up to join the conversation.