

The PPI numbers exceeded the highest estimate of every economist surveyed.
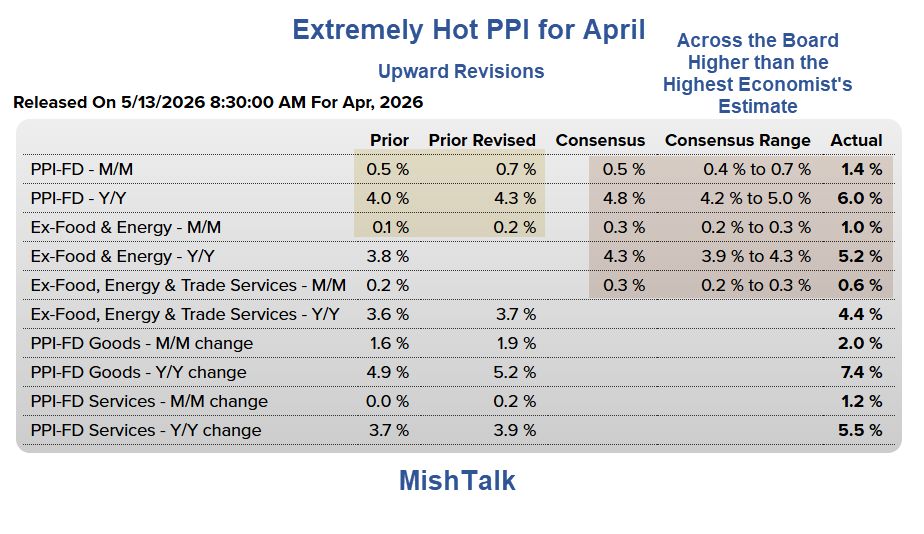
Image source 2026 Econoday Economic Calendar.
In addition to well above consensus estimates, there were upward revisions to March month-over-month and year-over-year numbers.
Biggest Leap in PPI since March 2022
Please consider the BLS Producer Price Report for April 2026.
The Producer Price Index for final demand increased 1.4 percent in April, seasonally adjusted. Final demand prices advanced 0.7 percent in March and 0.6 percent in February.
The April increase is the largest advance since rising 1.7 percent in March 2022. On an unadjusted basis, the index for final demand rose 6.0 percent for the 12 months ended in April, the largest 12-month increase since moving up 6.4 percent in December 2022.
Nearly 60 percent of the April rise in final demand prices can be attributed to a 1.2-percent advance in the index for final demand services. Prices for final demand goods moved up 2.0 percent.
The index for final demand less foods, energy, and trade services increased 0.6 percent in April, the largest advance since rising 0.6 percent in October 2025.
For the 12 months ended in April, prices for final demand less foods, energy, and trade services moved up 4.4 percent, the largest 12-month increase since jumping 4.5 percent in February 2023.
PPI Final Demand Month-Over-Month
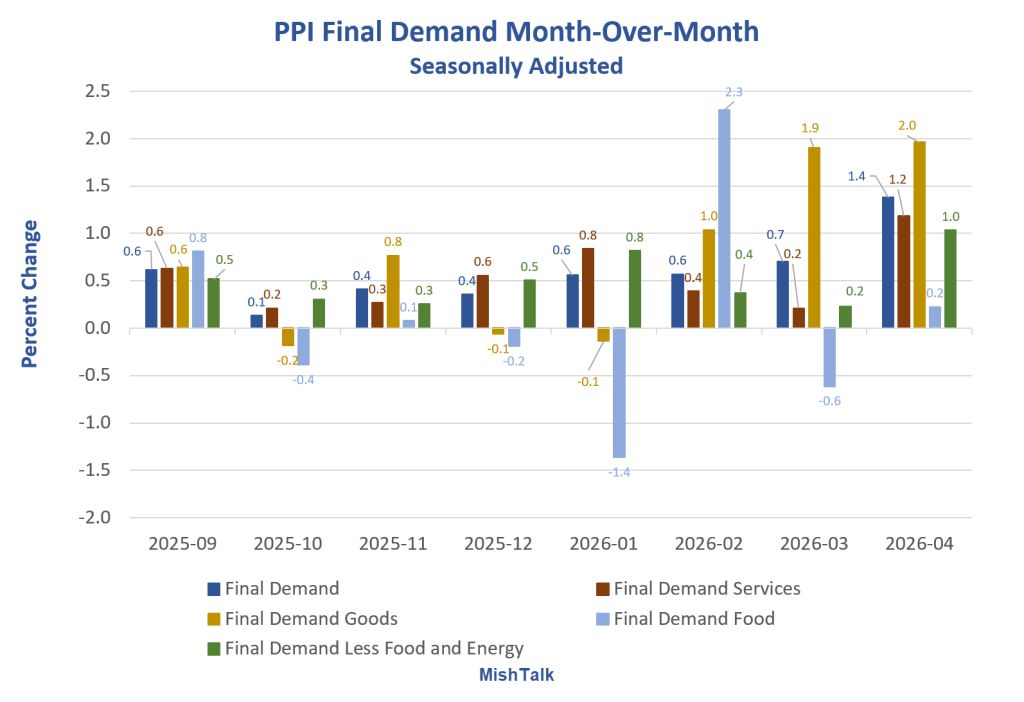
PPI Final Demand Month-Over-Month Details
Final Demand: 1.4 percent
Final Demand Goods: 2.0 percent
Final Demand Services: 1.2 percent
Final Demand Food: 0.2 percent
Final Demand Less Food and Energy: 1.0 percent
Final Demand Synopsis
Final Demand Services: The index for final demand services rose 1.2 percent in April, the largest increase since moving up 1.3 percent in March 2022. Two-thirds of the broad-based advance in April can be traced to a 2.7-percent jump in margins for final demand trade services. (Trade indexes measure changes in margins received by wholesalers and retailers). The indexes for final demand transportation and warehousing services and for final demand services less trade, transportation, and warehousing also rose, 5.0 percent and 0.1 percent, respectively.
Services Detail: A major factor in the April advance in prices for final demand services was a 3.5- percent increase in margins for machinery and equipment wholesaling. The indexes for truck transportation of freight; fuels and lubricants retailing; health, beauty, and optical goods retailing; chemicals and allied products wholesaling; and legal services also moved higher. Conversely, prices for portfolio management fell 2.4 percent. Margins for food retailing and for metals, minerals, and ores wholesaling also decreased. (See table 2.)
Final Demand Goods: The index for final demand goods advanced 2.0 percent in April after rising 1.9 percent in March. More than three-quarters of the broad-based increase in April can be traced to a 7.8-percent jump in prices for final demand energy. The indexes for final demand goods less foods and energy and for final demand foods also moved up, 0.7 percent and 0.2 percent, respectively.
Goods Detail: Over 40 percent of the April advance in prices for final demand goods can be attributed to a 15.6-percent increase in the index for gasoline. Prices for jet fuel, diesel fuel, fresh and dry vegetables, industrial chemicals, and residual fuels also rose. In contrast, the index for chicken eggs dropped 49.7 percent. Prices for nonferrous scrap and for residential natural gas also fell.
PPI Final Demand Year-Over-Year
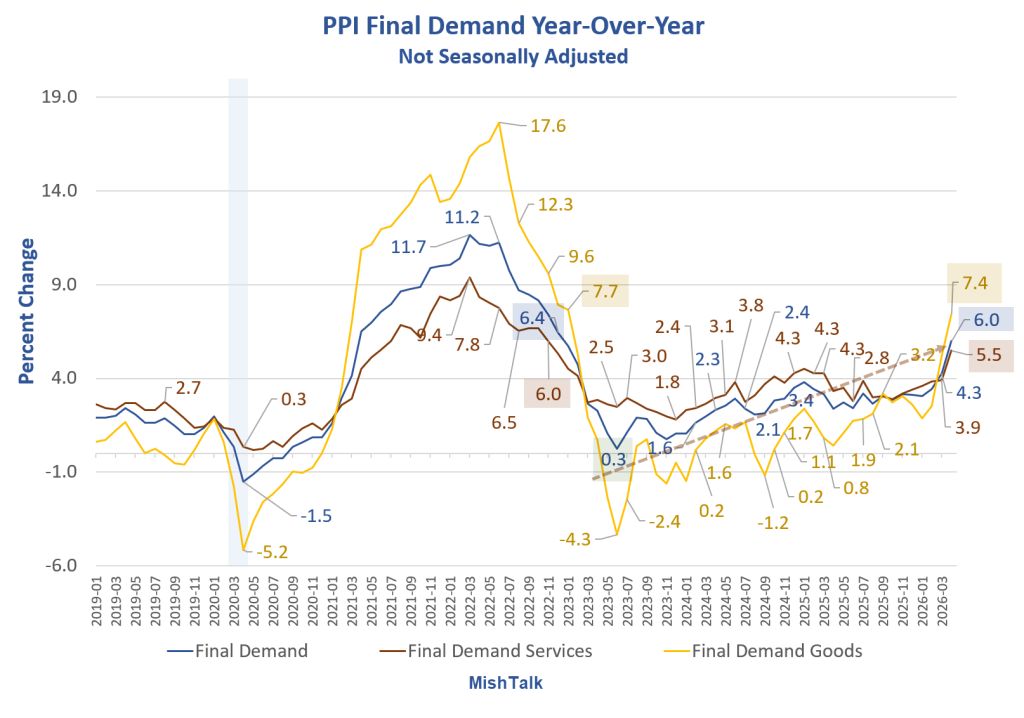
PPI Final Demand Notes
Final Demand: 6.0 percent, highest since 6.4 percent in December 2022
Final Demand Goods: 7.4 percent, highest since 7.7 percent in January 2023
Final Demand Services: 5.5 percent, highest since 6.0 percent in November 2022
PPI Final Demand Services
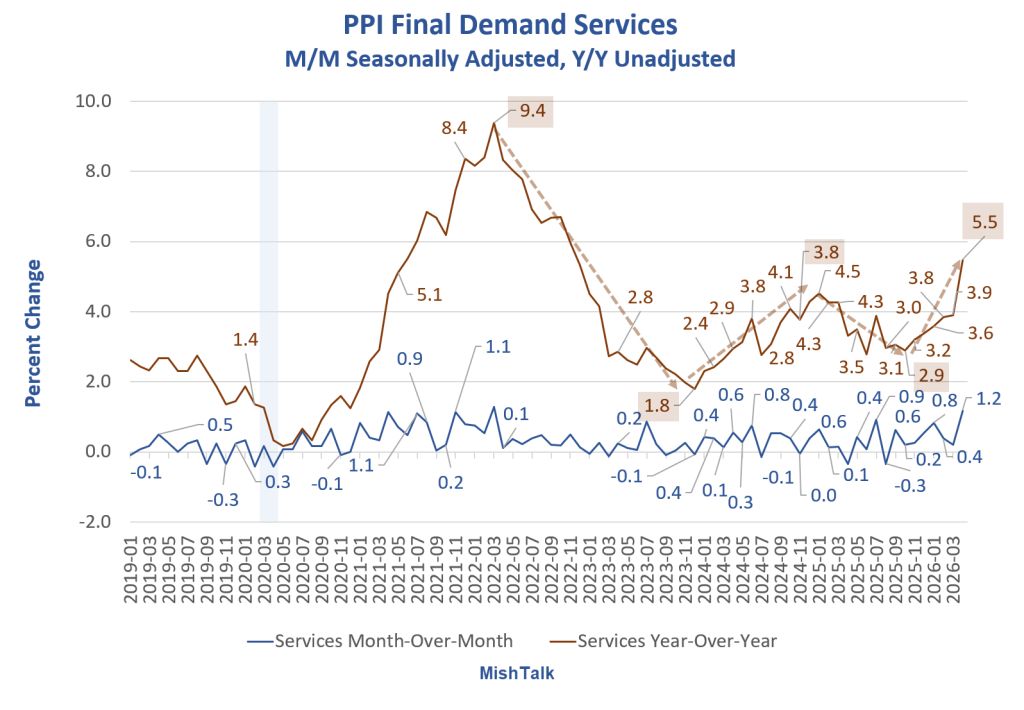
Services Key Points
Services represent a dominant portion of the Producer Price Index (PPI) for final demand, accounting for approximately 68% to over 70% of total PPI coverage as of early 2026.
Services are often the primary driver of PPI inflation, significantly outweighing goods.
The trend in services is now ominous. Year-over-year services PPI is up 5.5 percent, the most since 6.0 percent in November 2022.
Intermediate Demand
Processed Goods for Intermediate Demand: The index for processed goods for intermediate demand increased 2.7 percent in April, the sixth straight advance. More than half of the broad-based April rise can be traced to prices for processed energy goods, which moved up 7.8 percent. The indexes for processed materials less foods and energy and for processed foods and feeds also advanced, 1.5 percent and 0.4 percent, respectively. For the 12 months ended in April, prices for processed goods for intermediate demand moved up 9.4 percent, the largest 12-month rise since jumping 10.1 percent in October 2022.
Processed Goods Detail: Nearly a quarter of the April advance in the index for processed goods for intermediate demand is attributable to prices for diesel fuel, which jumped 12.6 percent. The indexes for jet fuel, gasoline, industrial chemicals, electronic components and accessories, and plastic resins and materials also increased. Conversely, prices for natural gas to electric utilities declined 3.5 percent. The indexes for beef and veal and for industrial gases also fell.
Unprocessed Goods for Intermediate Demand: Prices for unprocessed goods for intermediate demand rose 4.1 percent in April, the sixth consecutive increase. More than 80 percent of the April advance can be traced to the index for unprocessed energy materials, which moved up 9.2 percent. Prices for unprocessed foodstuffs and feedstuffs rose 2.7 percent. In contrast, the index for unprocessed nonfood materials less energy declined 1.0 percent. For the 12 months ended in April, prices for unprocessed goods for intermediate demand advanced 20.9 percent, the largest 12-month increase since jumping 29.2 percent in September 2022.
Unprocessed Goods Detail: Nearly three-quarters of the April advance in the index for unprocessed goods for intermediate demand can be attributed to prices for crude petroleum, which moved up 11.3 percent. The indexes for raw milk, slaughter steers and heifers, natural gas, iron and steel scrap, and fresh vegetables (except potatoes) also rose. Conversely, prices for nonferrous scrap decreased 4.4 percent. The indexes for corn and for hay, hayseeds, and oilseeds also declined.
The Intermediate Demand (ID) Producer Price Index (PPI) measures price changes for goods, services, and construction sold to businesses as inputs for production, excluding capital investment.
Uses of the Data
Inflation Indicator: Highlights input price pressures that may lead to future changes in final consumer prices.
Contract Escalation: Businesses use these indices to adjust long-term supply contracts.
Economic Analysis: Helps economists and businesses measure changing input costs and profit margins.
Except for one-time increases or random fluctuations, intermediate price pressures tend to eventually find their way into final demand cost increases.
What’s happening now is neither temporary nor random. Price pressures will persist as long as the strait is closed.
Fed Behind the Curve?
Q: Is the Fed behind the curve?
A: Yes, obviously.
Q: Why?
A: The Fed still has an easing bias with three dissents.
At a minimum, the Fed’s bias should be towards hiking, not cutting rates. Inflation is clearly not under control.
This of course presumes the Fed can do anything realistic about this. But to be internally consistent, discussion of cutting rates seems ridiculous.
Meanwhile,Trump keeps making matters worse not only with Mideast policy but with tariff policy.
Related Posts
May 12, 2026: CPI Hotter than Expected, Highest in Three Years, a Genuine Disaster
Inflation in April was another scorcher. Here are some month-over-month and year-over-year charts.
May 12, 2026: Real Hourly Earnings Decline Again, No Growth Since Trump Took Office
If it feels like you are not getting ahead, it’s because you aren’t. Six charts.
May 13, 2026: Two Reasons the CPI Report Will Give the Fed Severe Headaches
There are two very troubling aspects of the latest BLS CPI report. Did you spot them?

Comments
Log in or sign up to join the conversation.