


Since last week’s gamma squeeze, the market really hasn’t done much, with the S&P 500 (SPX) finishing the week slightly higher and stuck in a range between roughly 7,750 and 7,800 since the beginning of the month. Implied volatility has moved all the way down, with the VIX at 14.25, the lower end of its recent range. At the same time, the dispersion trade (a strategy that trades single-stock volatility against index volatility) has unwound fairly meaningfully over the last several weeks, and single-stock volatility has come down hard.
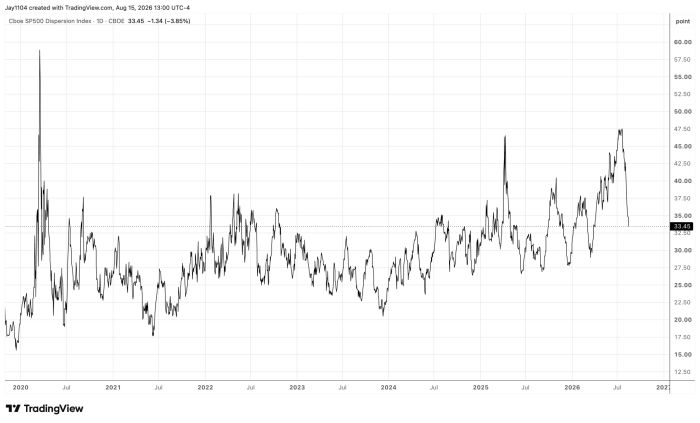
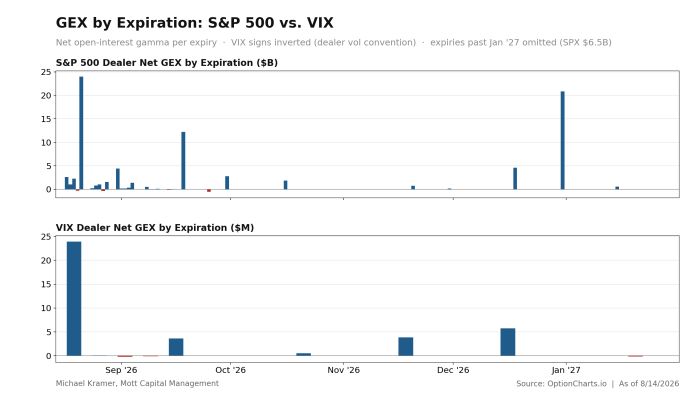
That sets up what could be an interesting week, with VIX options expiring Wednesday morning and monthly OpEx on Friday. Most of the gamma concentration in both the S&P 500 and the VIX comes off on those two days. Once it does, the market will be freer to move in either direction, and the pinning effects that have kept realized volatility low should begin to diminish.
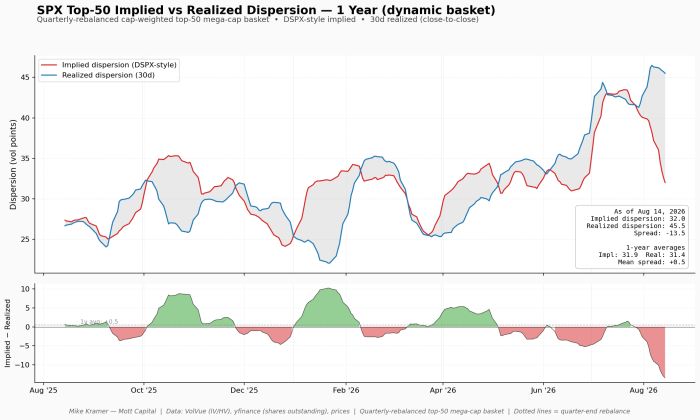
Looking at the top twenty-five names in the S&P 500 basket I reweight every quarter, implied dispersion has come down sharply, while the realized dispersion component really hasn’t budged yet. I think that is one of the reasons we haven’t seen correlations rise alongside the unwinding of the dispersion trade. The top fifty tell the same story: one-month implied correlations are just starting to move up, while realized correlations haven’t really moved. As dispersion comes down, we would expect correlations to rise, with single-stock implied volatility trading more in line with the index, but that hasn’t happened yet. The other side of the unwind should mean index volatility moves up.
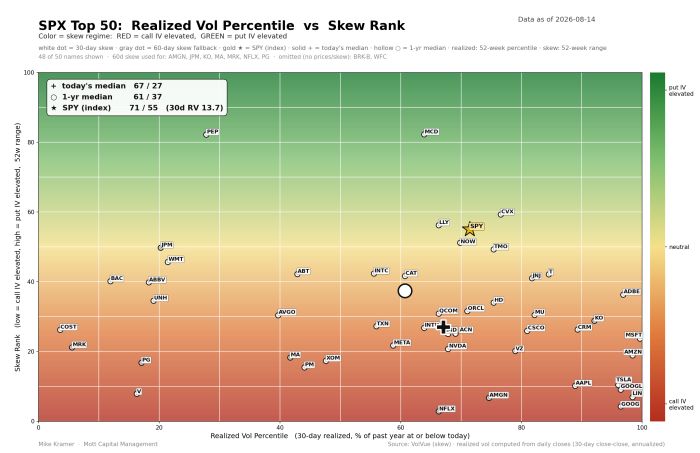
Among the individual components, SPY sits at just the fourth percentile for implied volatility over the past year, while the median stock is closer to the thirty-first percentile. Nearly everything has been gravitating toward the lower left of the map, meaning implied volatility is falling sharply, with skew tilted toward the call side and investors still basically betting on upside.
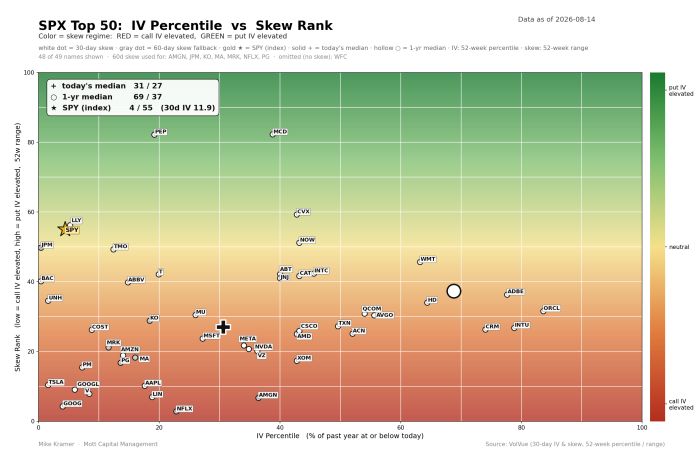
Realized volatility paints a different picture. SPY is up in its seventy-first percentile, with 30-day realized volatility around 13.7, and the median name is near its sixty-first percentile. Implied volatility is anticipating a calmer market, but realized volatility hasn’t started to move lower yet in single-stock names, and I think that is part of why not much is happening in the market right now.
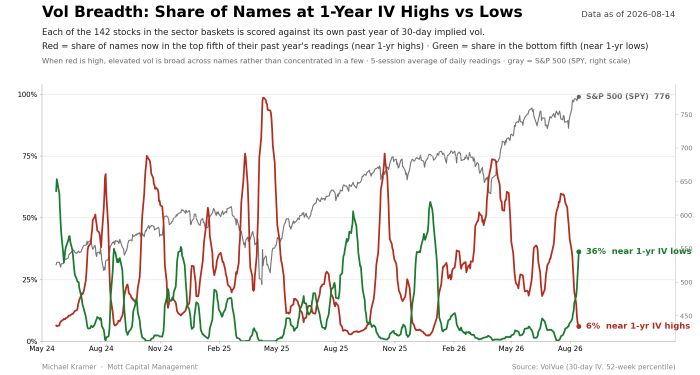
The breadth data show the same flip. A month ago, before earnings, roughly 60% of names were near their one-year highs in implied volatility; that share is now down to 6%, while the share near one-year lows has gone from almost zero to 36%. On skew, about 19% of names are trading at their one-year lows versus only 2% at their highs, which points to plenty of demand for calls but not much for puts, while implied volatility melts.
The final piece is dealer positioning. Gamma positioning in the S&P 500 has been rebuilt from a deeply short position, which was the implied volatility squeeze that sent the index sharply higher, and the market has been stuck since. With gamma and delta positioning relatively high, the conditions remain in place to keep index volatility pinned, because market makers hedging these flows buy pullbacks and sell rallies. The VIX is the same idea, with negative delta exposure and positive gamma exposure, so dealers sell strength and buy dips, which has helped contain the VIX and is one reason for the relentless volatility crush of the last several sessions.
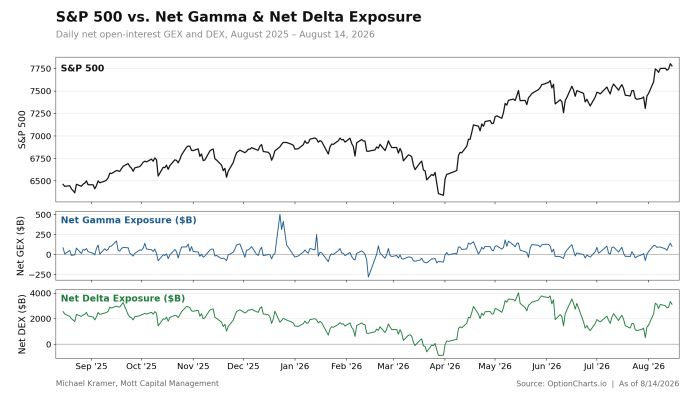
Once we get past Wednesday’s VIX expiration and Friday’s OpEx and these gamma and delta positions roll off, both the index and the VIX should be able to move more freely. That could push realized volatility higher than implied, and finally bring the missing piece, rising correlations, which, given where the VIX sits, could lead to more volatility and a pullback in the S&P 500. It is all circumstantial and just where the evidence points right now, but that is how I would frame the next two to three weeks heading into September.



Comments
Log in or sign up to join the conversation.