
- SPX Monitoring purposes; Sold SPX 3/28/19 & 2815.44= gain .61%; Long 2798.36 & 3/25/19.
- Monitoring purposes GOLD: Long GDX on 1/29/19 at 21.96.
- Long Term Trend SPX monitor purposes; Long SPX on 10-19-18 at 2767.78
(Click on image to enlarge)
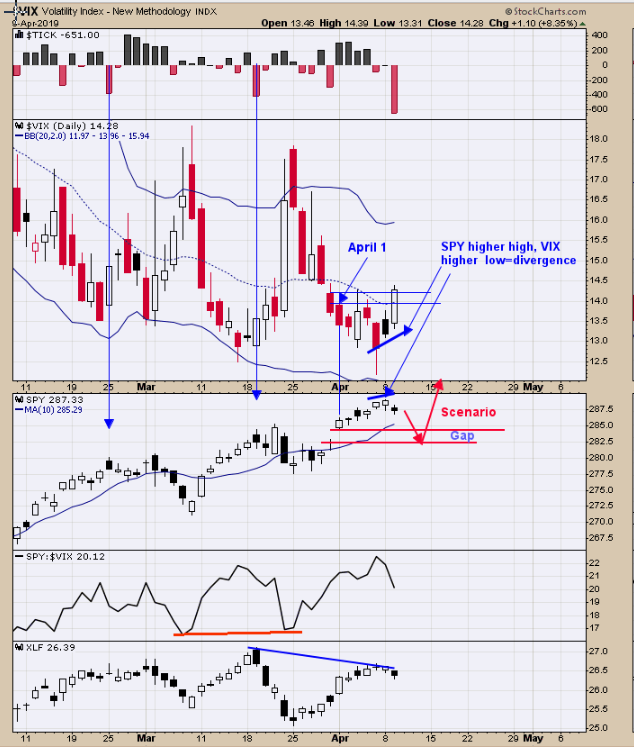
Next week is option-expiration week and the week before (this week) is where whipsaws are common in the market. VIX trades opposite of the SPY and when there is a divergence a pullback in the SPY is possible. Some times the VIX leads in price (opposite direction) to where SPY is heading. Today the VIX reached it April 1 high and suggest the SPY will reach its April 1 low near 282.50 SPY range (2825 SPX). The VIX remains below +16 and intermediate-term bullish for the SPY. Fun fact that April option expiration week is up 65.71% of the time.
(Click on image to enlarge)
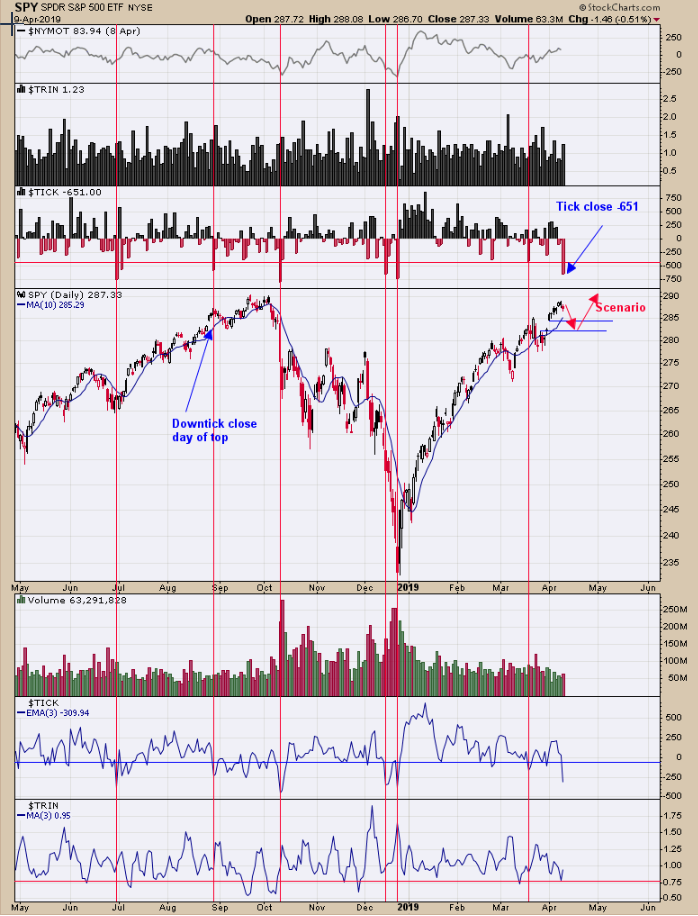
Today the Trin closed at 1.23 and the tick at -651. If the market was down for several days these readings would have indicated a short term low is nearby. Coming the day after a high can be a little tricky as some times these type of reading confirm a downtrend and other time it mean a low is near; so which is it? Most likely we will move lower short term as this is the week before option expiration week and has a bearish lean and also yesterday’s Total Put/Call reading of .76 suggests a short term bearish edge. As said before the Ticks closed at minus 651 and going back and checking we found that when ticks close this negative the market is up a modest amount next day over 80% of the time (identified with red vertical lines).Look for a minor bounce tomorrow than down into Thursday or Friday or both where a signal could develop. A possible target for a low is April 1 gap near 2825 SPX. Fun statistics is that with VIX under +16 and SPX up +10% last 3 months, April is higher 90% of the time averaging 2.75% gain.
(Click on image to enlarge)
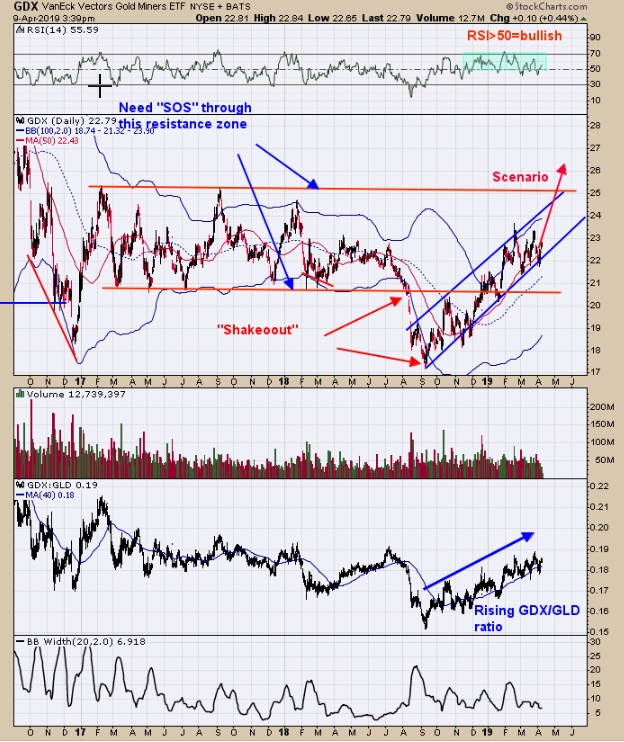
Above is the daily GDX chart with its channel lines. Back last August, GDX fell through support near 21.00 and then rallied back above 21.00 in January creating a bullish “Shakeout”.It is said, “If a market can’t hold below its previous lows, it will reverse and attempt to takeout the previous highs.”The previous highs, in this case, is the 25.00 range and it appears where GDX is heading.GDX has been trading in an up trending parallel “Channel lines”.GDX found support at the lower channel line in early April and it appears now may head to the upper channel line which could be reached in early May near 25.00 range. The second window up from the bottom is the GDX/GLD ratio which has been rising since last September and shows that gold stocks is outperforming gold and is a bullish condition for both gold and gold stocks. The trend is up for now and a possible resistance zone may be reached in early May near 25.00 area. Long GDX on 1/29/19 at 21.97.

Comments
Log in or sign up to join the conversation.