

The past several weeks in the market have been very volatile and plagued with anxiety. Some indicators are pointing towards an economic slowdown, and the trade war negotiations are adding even more uncertainty to the market environment. The most damaging bear markets generally come during recessions, so it makes sense for investors to be worried about recession risk.
The yield curve inversion and the weakness in the manufacturing sector are two major warning signs to consider. However, economic indicators related to the jobs market, leading indicators, financial conditions, and housing still look quite strong.
However, even if a recession does not seem very likely in the short term, investors need to be well prepared for a bear market because sooner or later, we are going to have to face one. Trend following strategies for portfolio protection are not perfect or infallible, but they are very effective at reducing the risk of massive losses during bear markets.
Investors Are Fearful
There is plenty of fear in the market nowadays. According to a UBS survey of 360 global family offices with an average family wealth of $1.2 billion, 55% of respondents expect a recession next year, and 45% are already adjusting their portfolios for such a scenario.
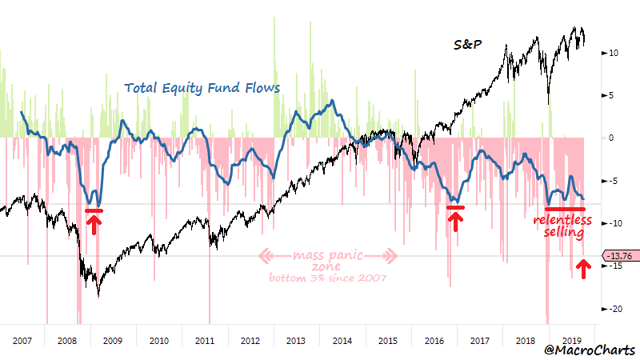
The chart from MacroCharts shows the S&P 500 and the equity fund flows. Investors have been selling stocks at full speed recently, with selling pressure reaching extreme levels.
Source: MacroCharts
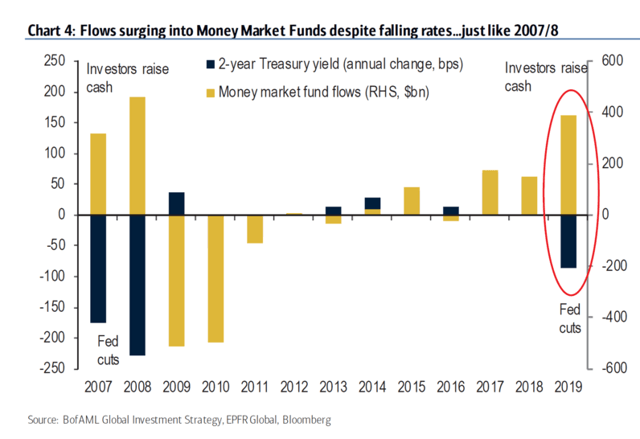
Offering a similar perspective, this chart from Bloomberg shows that investors have been raising cash like there is no tomorrow. Over the past six months, money market funds attracted $322 billion of inflows, this is the largest flight to safe assets since the second half of 2008.
Source: Bloomberg.
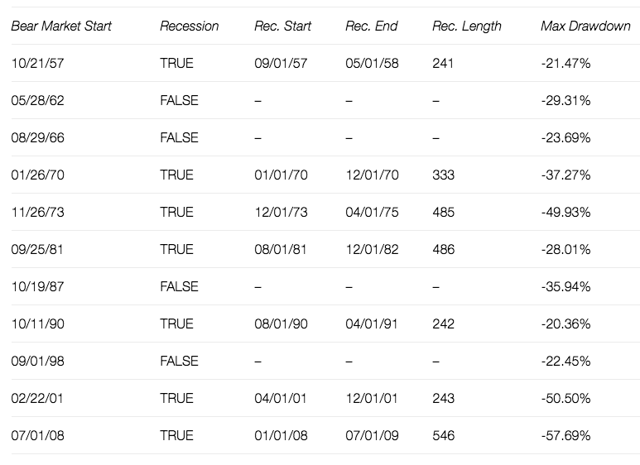
History shows that we can get some big market pullbacks even without a recession, but the deepest and most concerning bear markets generally come during recessions. The table shows the different bear markets over the past decades, including the distinction of recession or not and the size of the losses.
A recession makes a bear market much more likely, and the bear markets that come within a recession generally produce more damage than the bear markets that happen outside of recessions.
Source: DQYDJ
In simple terms, there is plenty of pessimism in the market right now, and this is due to the fact that many investors are expecting a recession in the middle term. If such a recession materializes, then those fears will turn out to be right, and stocks will probably deliver disappointing returns.
However, generalized fear many times creates opportunities. As Warren Buffett said, the time to be greedy is when others are fearful. If the economy avoids a recession in the coming months, then stocks could deliver attractive returns ad investor fears are proven wrong.
How Close Are We To A Recession?
The big question in this context is: How high are the chances of a recession in the middle term?
We can never know for sure what will happen in the future, but we can take a weight of the evidence approach to evaluate this question based on a multiplicity of indicators.
Let's begin with the most concerning indicators, with the inversion in the yield curve and the decline in manufacturing being particularly worrisome.
The 3 months-10 years yield curve has been inverted for more than 50 days. The curve actually turned positive last week, but the inversion is still the main signal from an economic perspective.
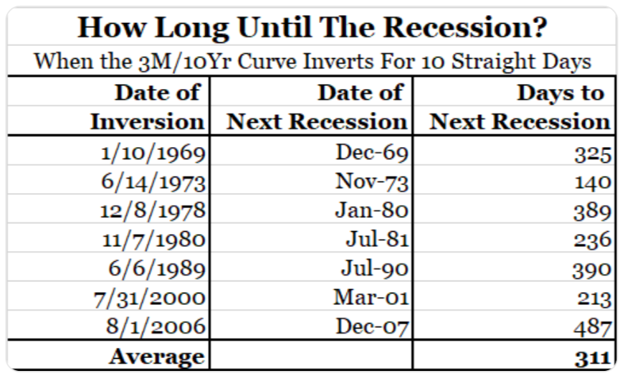
Looking at the US economy over the past several years, in seven out of seven occasions, an inversion in the yield curve has preceded a recession. But, on average, it took 311 days since the inversion and the start of the recession.
Source: Bianco Research
There is a reduced number of instances of yield curve inversions in the US over recent years, so it's hard to reach valid conclusions from such limited evidence. For this reason, the analysts at Dimensional have compiled the relation between yield inversions and subsequent market returns in different countries over the past 40 years.
In 10 out of 14 cases of inversion, local investors would have had obtained positive returns investing in those markets after 36 months. Performance metrics after inversions are roughly similar to the historical returns in these markets, regardless of the shape of the yield curve.
According to the available data, trying to predict the direction of the stock market based on the shape of the yield curve doesn't seem like a good idea.
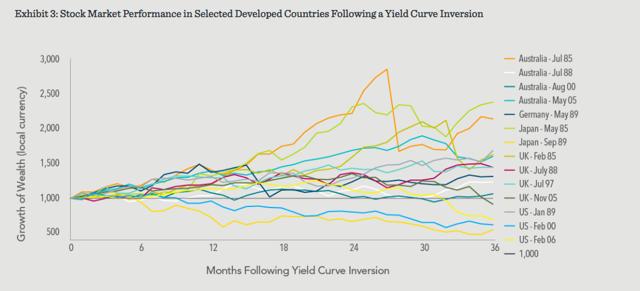
Source: Dimensional
Manufacturing activity is in contraction all over the world and the US is no exception. When the ISM index is below 50, this is signaling contraction, and it came at 47.8 for September.

Source: Advisor Perspectives
Looking at the recent evidence, the big notable exception happened when the ISM crossed below 50 in February of 2008, and the S&P 500 was down by a massive 47% one year later. However, more recent signals in 2012 and 2015 were buying opportunities in stocks, with the S&P 500 rising by 19% and 12% in the following year respectively.
In other words, the manufacturing sector is clearly hurting, and it could be a major drag on the rest of the economy if things keep getting worse. But the past two occasions in which the ISM index declined substantially turned out being buying opportunities as opposed to reasons to sell stocks.
The contraction in industrial activity is a key factor to watch going forward, but it is not enough reason to say that we are necessarily entering a recession in the short term.
Moving on to more encouraging data, the jobs market remains strong, as shown by the initial jobless claims numbers. Jobless claims generally start rising before a recession - grey areas in the chart - and the numbers are still looking quite good.
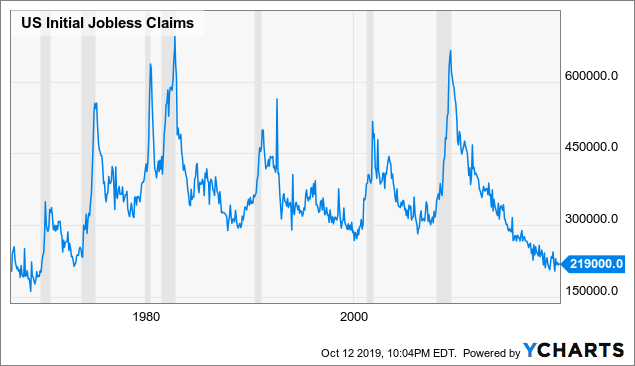
Data by YCharts
The same goes for the Philly Fed US Leading Index. A leading index is specially designed to rapidly warn us of an impending recession, even when such a recession risk is not visible in the coincident indicators. This indicator generally starts trending down before a recession, and it's still showing healthy prospects for the economy.
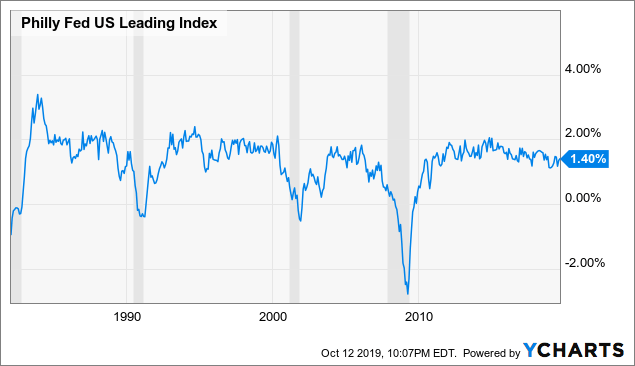
Data by YCharts
Financial conditions remain very comfortable. The financial conditions index signals problems for the economy when it is above zero, and it remains well below such a critical level.
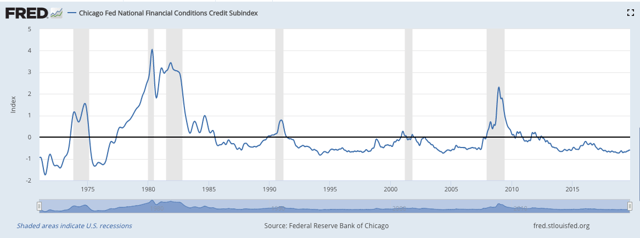
Source: Federal Reserve Bank of Chicago
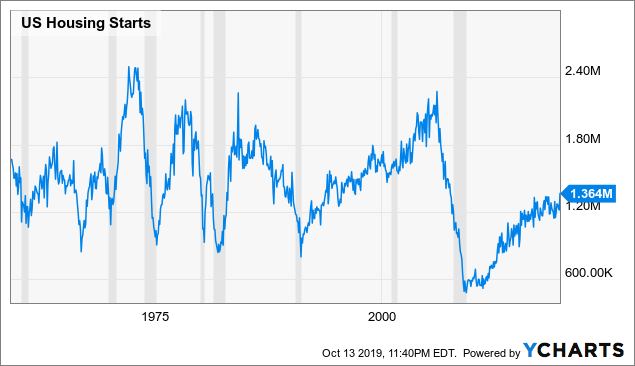
The same goes for housing starts. We generally see housing starts declining well in advance of recessions, and the data looks quite solid in recent months.
Data by YCharts
The inversion of the yield curve is reflecting broad expectations for an economic slowdown, and this indicator has been very effective in the past. However, this is mostly a long-term indicator, and it does not have much value as a market-timing tool.
The decline in manufacturing activity is obviously related to the trade war, and we cannot overlook the possibility that manufacturing could drag other sectors of the economy down in the coming months. That said, as long as the economic weakness remains contained in the manufacturing sector, a full-blown recession can be avoided.
Things could always change rapidly, especially if there are some big disruptions in terms of economic policy or due to economic weakness overseas. However, I would say that the data currently available is saying that the probabilities of a recession in the US are relatively low over the coming 3 to 6 months. Arguably below 30% over such a time frame.
Over a longer time frame, however, it is much harder to know. We just need to see how the data evolves over time, especially in the manufacturing sector, which has been under a lot of pressure in recent months.
Having A Plan For All Kinds Of Environments
Based on the indicators shown above, the risk versus reward tradeoff in stocks looks quite attractive because the market seems to be overestimating the probabilities of a recession in the next couple of quarters.
However, the most important thing is not having the right view at a particular point in time, but rather building a consistent investment strategy that can successfully go through all kinds of environments. Sooner or later, you are going to have to face a bear market, and it makes a lot of sense to be prepared in advance.
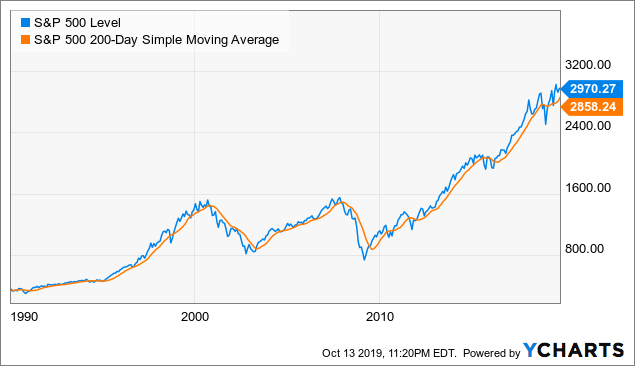
A simple and effective way to protect the portfolio based on a trend following approach is using the 200-day moving average as a trend indicator for the market. The chart below shows the evolution of the S&P 500 index and the 200-day moving average over the long term.
Data by YCharts
Even if there have been some false signals over the years, the indicator has done a solid job in terms of capturing the big bull and bear markets over the decades. Based on the statistical evidence, this strategy can do a solid job at terms of providing portfolio protection.
The table below is from a research article from Alpha Architect entitled Trust The Process. We begin with the historical returns and risk metrics for the S&P 500, international stocks (EAFE), T-bonds, REITs, and commodities from 1973 to 2017.
| SP500 | EAFE | T-Bond | REITs | Commodities | |
| CAGR | 10.52% | 8.49% | 7.75% | 11.94% | 5.84% |
| Standard Deviation | 15.14% | 17.03% | 8.15% | 16.88% | 20.34% |
| Sharpe | 0.43 | 0.29 | 0.39 | 0.48 | 0.15 |
| Maximum Drawdown | -50.21% | -56.68% | -20.97% | -68.30% | -80.90% |
Data Source: Trust The Process, by Jack Voguel
Now, we can take a look at the risk and return statistics for these asset classes when applying a trend following strategy to them. The strategy basically sells and moves to cash when the asset is trading below the 200-day moving average.
| SP500 (trend) | SP500 (trend) | EAFE (trend) | T-Bond (trend) | REITs (trend) | Com. (trend) |
| CAGR | 10.87% | 9.85% | 7.67% | 11.57% | 8.12% |
| Standard Deviation | 11.58% | 12.10% | 6.88% | 12.03% | 16.26% |
| Sharpe | 0.55 | 0.45 | 0.43 | 0.59 | 0.27 |
| Maximum Drawdown | -23.58% | -21.08% | -11.26% | -20.77% | -57.41% |
Data Source: Trust The Process, by Jack Voguel
The main takeaway is quite clear - trend following strategies can increase returns in many cases, and they substantially reduce the downside risk across all the asset classes considered.
The maximum drawdown - meaning maximum capital loss from the peak - is 50.2% for buy and hold investors in the S&P 500 and a much smaller 23.58% for the trend following strategy over the same period. In other asset classes, trend following can be even more effective at reducing drawdowns.
It is important to keep in mind that trend-following strategies generally work well when the market has a clear direction, either up or down. On the other hand, when the market is moving sideways and trends are inconsistent, a strategy such as this one will provide lots of false signals and ultimately disappointing returns.
This being fully acknowledged, trend following strategies supported by hard data and with a solid track record of performance can be remarkably effective in terms of reducing the risk of big capital losses over the long term.
No matter what you think the market will do next, you always need to be prepared for a bear market. Implementing trend-following strategies for portfolio protection can be a smart way to capitalize on favorable market environments while also having a time-tested system to protect your capital when markets start moving in the wrong direction.



Comments
Log in or sign up to join the conversation.